D.6 Supplementary information
To ensure a robust analysis is undertaken, it is important that there is sufficient data available to use.
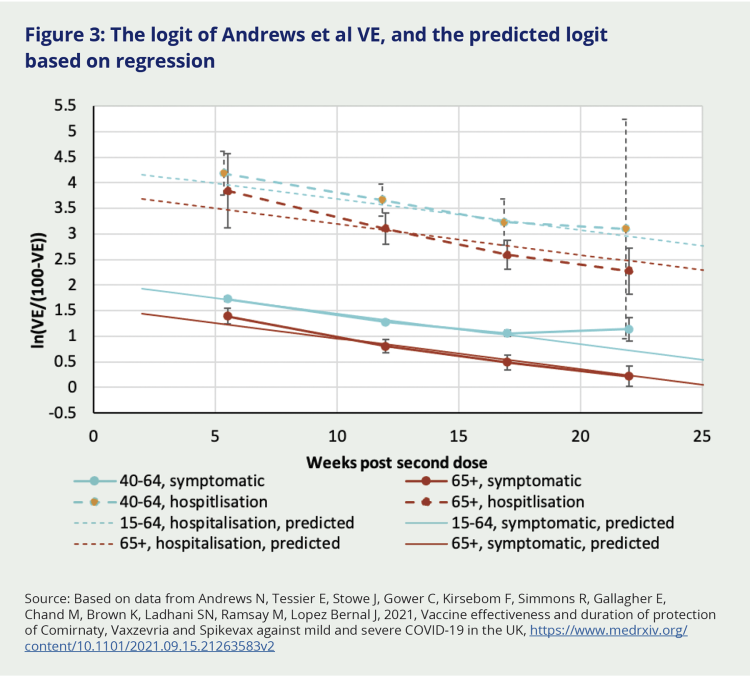
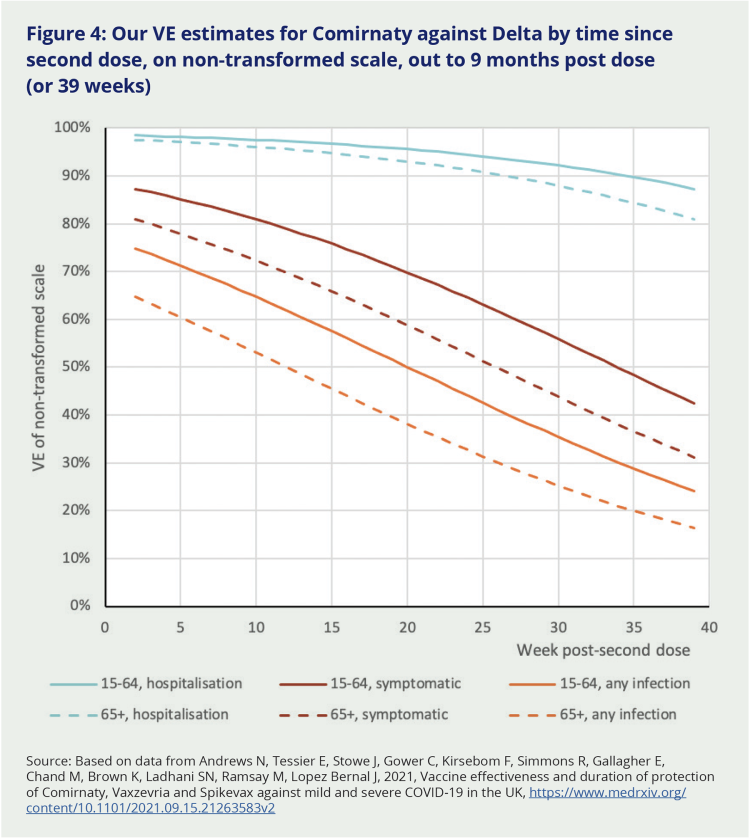
For the example undertaken here, the VE estimates we used (from Andrews et al, 20211) are listed in Table 2. For this example we ‘smoothed’ the Andrews et al VE estimates using a log odds VE method developed by Blakely and colleagues in 2021 and published as a peer reviewed publication in 2022 (Szanyi et al (2022)).2 Figure 3 presents the vaccine waning on both the untransformed and logit scale for Comirnaty and Delta, using the data reported by Andrews et al (2021)3 fitted to our logit regression model.v The regression analysis predicting VE for Comirnaty against Delta, back on the non-transformed scale that is easier to interpret, are shown in Figure 4. Also shown is the estimated VE against any infection (which is what matters more for transmission in the population than protection against symptomatic illness), assuming the average VE for both the 20–64 age group and the 65 and over age group is 70 percent at two weeks following the second dose, and otherwise the same age difference and waning (on logit scale) as per the above regression equation. The value of this data is that it shows the decreasing impact of the vaccine on protection against becoming ill and against hospitalisation with increased time post vaccination. Similar data would need to be used to undertake this analysis in a future pandemic.
Estimating the average VE by sex, age and severity (namely, any infection, symptomatic illness, hospitalisation or death) was a matter of working out the average VE for every person by week, allowing for time since they were vaccinated.
Table 2: Estimates of Comirnaty vaccine effectiveness against Delta symptomatic illness and hospitalisation from Andrews et al (2021 preprint), on both the non-transformed and logit scales
| Weeks post second dose (assumed mid-point for modelling) | |||||
|---|---|---|---|---|---|
| 2 to 9 (5.5) | 10-14 (12) | 15-19 (17) | 20+ (22) | ||
| VE (95% confidence interval) | |||||
| Symptomatic illness | 15-64 years | 84.9 (84.3 to 85.4) | 78.2 (77.5 to 78.9) | 74.2 (73.1 to 75.3) | 75.7 (71.1 to 79.5) |
| 65+ years | 80.1 (77.5 to 82.4) | 69.1 (66.2 to 71.8) | 62.1 (58.6 to 65.4) | 55.3 (50.2 to 60) | |
| Hospitalisation | 15-64 years | 98.5 (97.7 to 99) | 97.5 (96.7 to 98.2) | 96.2 (94.1 to 97.5) | 95.7 (69.5 to 99.4) |
| 65+ years | 97.9 (95.9 to 99) | 95.7 (94.3 to 96.8) | 93 (90.9 to 94.6) | 90.7 (86 to 93.8) | |
| Logit VE = ln[VE/(100-VE)] (standard error †) | |||||
| Symptomatic illness | 15-64 years | 1.727 (0.022) | 1.277 (0.021) | 1.056 (0.029) | 1.136 (0.116) |
| 65+ years | 1.393 (0.078) | 0.805 (0.067) | 0.494 (0.074) | 0.213 (0.101) | |
| Hospitalisation | 15-64 years | 4.185 (0.216) | 3.664 (0.159) | 3.231 (0.228) | 3.103 (1.093) |
| 65+ years | 3.842 (0.368) | 3.103 (0.154) | 2.587 (0.143) | 2.278 (0.230) | |
† Calculated as the difference in logit of upper and lower 95 percent confidence limits, divided by 3.92. The inverse of square of this, being the inverse variance, was use as to weight the regression model.
Source: Based on data from Andrews N, Tessier E, Stowe J, Gower C, Kirsebom F, Simmons R, Gallagher E, Chand M, Brown K, Ladhani SN, Ramsay M, Lopez Bernal J, 2021, Vaccine effectiveness and duration of protection of Comirnaty, Vaxzevria and Spikevax against mild and severe COVID-19 in the UK, https://www.medrxiv.org/content/10.1101/2021.09.15.21263583v2
Figure 3: The logit of Andrews et al VE, and the predicted logit based on regression

Source: Based on data from Andrews N, Tessier E, Stowe J, Gower C, Kirsebom F, Simmons R, Gallagher E, Chand M, Brown K, Ladhani SN, Ramsay M, Lopez Bernal J, 2021, Vaccine effectiveness and duration of protection of Comirnaty, Vaxzevria and Spikevax against mild and severe COVID-19 in the UK, https://www.medrxiv.org/content/10.1101/2021.09.15.21263583v2
Figure 4: Our VE estimates for Comirnaty against Delta by time since second dose, on non-transformed scale, out to 9 months post dose (or 39 weeks)

Source: Based on data from Andrews N, Tessier E, Stowe J, Gower C, Kirsebom F, Simmons R, Gallagher E, Chand M, Brown K, Ladhani SN, Ramsay M, Lopez Bernal J, 2021, Vaccine effectiveness and duration of protection of Comirnaty, Vaxzevria and Spikevax against mild and severe COVID-19 in the UK, https://www.medrxiv.org/content/10.1101/2021.09.15.21263583v2
v Here we have used the logit of VE, generating coefficients (or differences on the logit scale) of -0.48441 for 65+ year olds compared to 40 to 64 year olds (standard error 0.06256), 2.23616 for protection against hospitalisation compared to protection against symptomatic illness (s.e. 0.11681), -0.06041 for week (s.e. 0.00418; that is, with each extra week since vaccination, the VE is exp(-0.06041) = 0.941 that of a week ago on the odds ratio scale), and an intercept of 2.04799 (s.e. 0.04944).

