1.3 Some key international comparisons Ētahi whakatauritenga hira o te ao
1.3.1 Low COVID-19 case numbers, hospitalisations and deaths
By preventing widespread COVID-19 infection until the population was vaccinated and the virus had become less deadly, Aotearoa New Zealand’s COVID-19 response protected Māori and Pacific communities and also prevented the premature deaths of thousands of New Zealanders – particularly older people, people living in disadvantaged circumstances, and people with co-morbidities, disabilities and/or medical vulnerabilities.
Aotearoa New Zealand’s COVID-19 case numbers were much lower than comparable countries in the first two years of the pandemic
Figure 1: COVID-19 cases (confirmed) per million people, 2020–2021
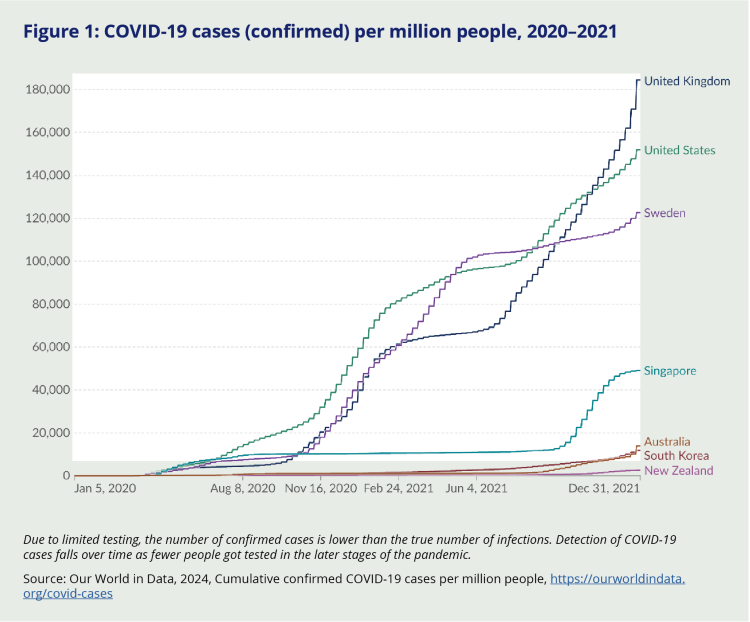
Due to limited testing, the number of confirmed cases is lower than the true number of infections. Detection of COVID-19 cases falls over time as fewer people got tested in the later stages of the pandemic.
Source: Our World in Data, 2024, Cumulative confirmed COVID-19 cases per million people, https://ourworldindata.org/covid-cases.
In the first two years of the pandemic, Aotearoa New Zealand had far fewer COVID-19 cases than most other countries. Most New Zealanders were not exposed to COVID-19 infection until 2022, by which time almost everyone had been vaccinated. This meant New Zealand had far fewer hospitalisations and deaths from COVID-19 compared with countries where the virus had circulated widely before vaccination became available.
Aotearoa New Zealand’s peak COVID-19 hospitalisation rate was around half the peak in the United States and United Kingdom
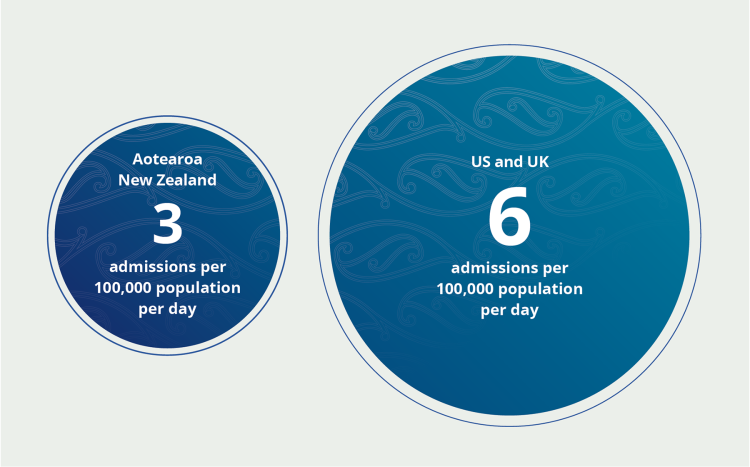
Aotearoa New Zealand’s COVID-19 hospitalisations peaked in March 2022, at just under three admissions per 100,000 population per day. By comparison, the United States and the United Kingdom experienced peak hospitalisation rates of more than 6 admissions per 100,000 population per day – approximately twice as high as that in Aotearoa New Zealandii Unlike other countries, New Zealand also recorded very few COVID-19 deaths among people living in residential facilities such as aged care homes.
Fewer people died from COVID-19 – or any cause – in Aotearoa New Zealand than in other OECD countries during the pandemic period
Aotearoa New Zealand experienced fewer COVID-19 deaths per head of population than almost any other OECD country. Moreover, Aotearoa New Zealand experienced ‘negative’ excess mortality (fewer deaths than would have been expected in a ‘normal’ year) from early 2020 until early 2023 (Figure 2).iii
Figure 2: Excess mortality (all cause) per million people, 2020–2023
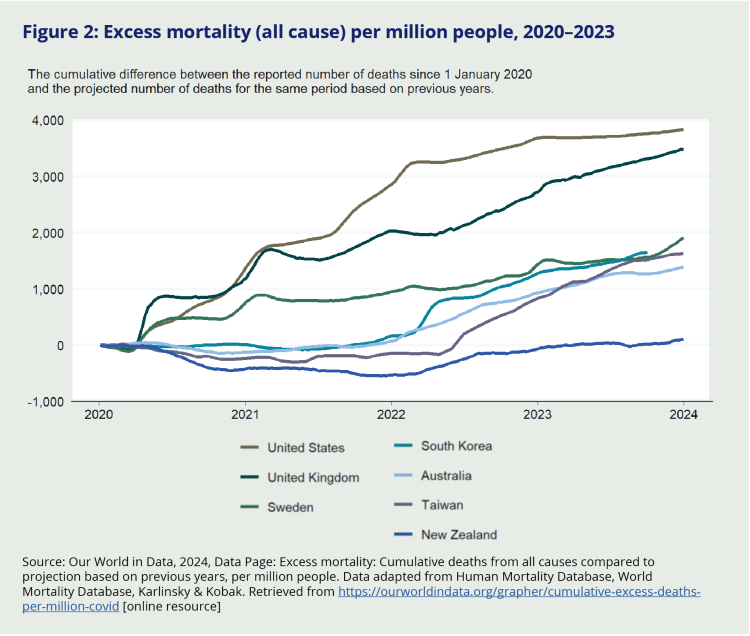
Source: Our World in Data, 2024, Data Page: Excess mortality: Cumulative deaths from all causes compared to projection based on previous years, per million people. Data adapted from Human Mortality Database, World Mortality Database, Karlinsky & Kobak. Retrieved from https://ourworldindata.org/grapher/cumulative-excess-deaths-per-million-covid [online resource]
Aotearoa New Zealand achieved a high level of vaccine coverage
Aotearoa New Zealand’s vaccination rollout was slightly slower to get started than in some other countries, but achieved a high level of coverage compared to international averages – and did so quickly. By 26 November 2021, 80 percent of the eligible population had received two doses of the vaccine – a considerable achievement given no vaccine rollout of this magnitude and speed had been attempted in Aotearoa New Zealand before.
Figure 3: Vaccine coverage by time for Aotearoa New Zealand and comparator countries, 30 December 2020–1 July 2022
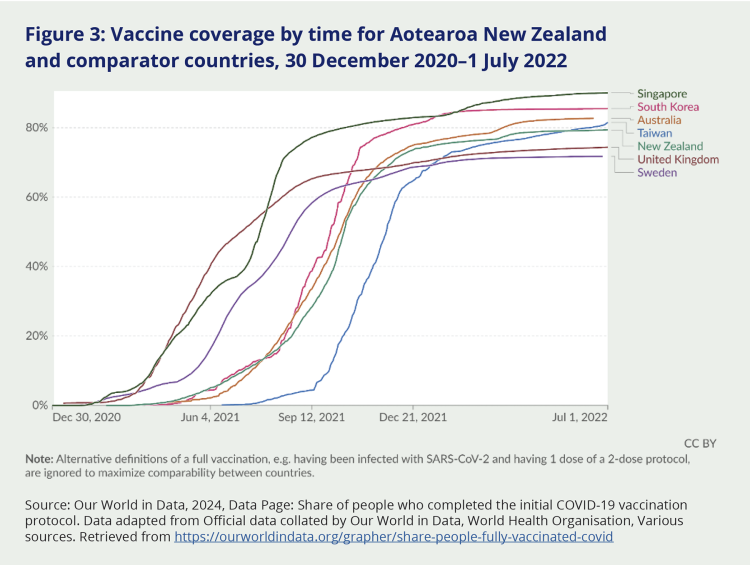
Source: Our World in Data, 2024, Data Page: Share of people who completed the initial COVID-19 vaccination protocol. Data adapted from Official data collated by Our World in Data, World Health Organisation, Various sources. Retrieved from https://ourworldindata.org/grapher/share-people-fully-vaccinated-covid
For more on the vaccine rollout, see Chapter 7. For more on case numbers, hospitalisations, mortality and the health system response, see Chapter 5. For more on the use of measures to encourage vaccine uptake, see Chapter 8.
Aotearoa New Zealand’s lockdown measures were strict, but New Zealanders spent less time in lockdown than many other countries
Figure 4: Oxford stringency index for Aotearoa New Zealand and comparator countries, 2020–2022 inclusive
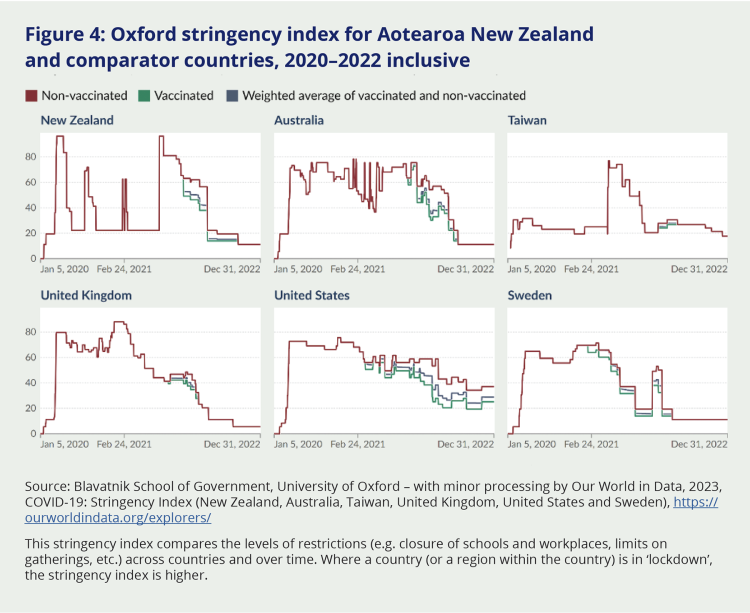
Source: Blavatnik School of Government, University of Oxford – with minor processing by Our World in Data, 2023, COVID-19: Stringency Index (New Zealand, Australia, Taiwan, United Kingdom, United States and Sweden), https://ourworldindata.org/explorers/ .This stringency index compares the levels of restrictions (e.g. closure of schools and workplaces, limits on gatherings, etc.) across countries and over time. Where a country (or a region within the country) is in ‘lockdown’, the stringency index is higher.
Under Alert Level 4 (full lockdown) Aotearoa New Zealand’s control measures were at the top of the stringency scale and stricter than many other countries. But New Zealanders spent comparatively little time under these conditions. After the initial lockdown, Aotearoa New Zealand spent much of 2020 and the first half of 2021 at Alert Level 1. During these periods, people faced far fewer domestic restrictions – apart from border restrictions affecting their ability to travel or, for some, to return home – than many other countries, including those pursuing suppression or mitigation strategies. As a result, New Zealanders were able to enjoy relatively normal lives for long periods of time: for example, people could gather in large numbers again, and travel domestically to visit family and friends.
For more on Aotearoa New Zealand’s use of lockdowns, see Chapter 3.
1.3.2 Strong economic and social outcomes
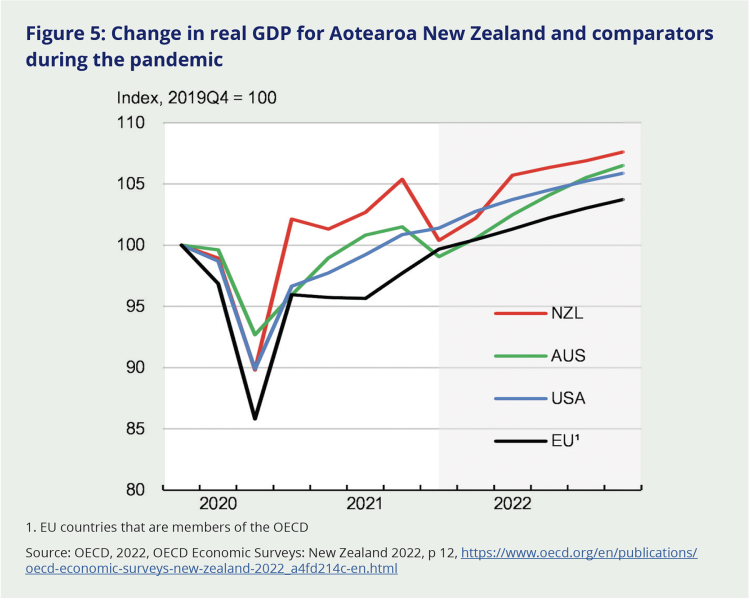
Aotearoa New Zealand’s economy recovered more quickly and strongly than other comparable countries
In Aotearoa New Zealand, as elsewhere, the arrival of the pandemic was accompanied by an immediate dip in GDP, reflecting the global impact of lockdowns on employment and economic activity. While Aotearoa New Zealand’s initial GDP fall was similar to that experienced in other OECD countries, the economy recovered more quickly and strongly here than elsewhere. This was due to a combination of factors, including the initial success of the elimination strategy allowing daily life and economic activity to resume quickly in 2020, and the protective effect of Aotearoa New Zealand’s generous economic support measures on jobs and incomes. By the third quarter of 2020, the economy regained its pre-pandemic levels – earlier than any other OECD country – and remained above this level through to the end of 2022.
Figure 5: Change in real GDP for Aotearoa New Zealand and comparators during the pandemic
1. EU countries that are members of the OECDSource: OECD, 2022, OECD Economic Surveys: New Zealand 2022, p 12, https://www.oecd.org/en/publications/oecd-economic-surveys-new-zealand-2022_a4fd214c-en.html
For more on the economic and social impacts and measures during the pandemic, see Chapter 6.
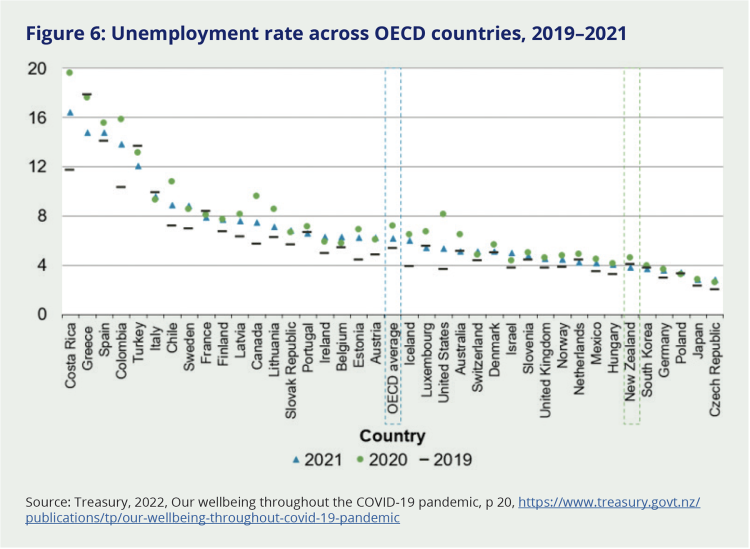
Aotearoa New Zealand’s unemployment rates remained low
While there was concern early on that the COVID-19 pandemic might precipitate widespread job losses and high unemployment, these risks did not eventuate. Aotearoa New Zealand has consistently had higher employment rates (and lower unemployment rates) than the OECD average, and this remained the case during the pandemic.
Figure 6: Unemployment rate across OECD countries, 2019–2021
Source: Treasury, 2022, Our wellbeing throughout the COVID-19 pandemic, p 20, https://www.treasury.govt.nz/publications/tp/our-wellbeing-throughout-covid-19-pandemic
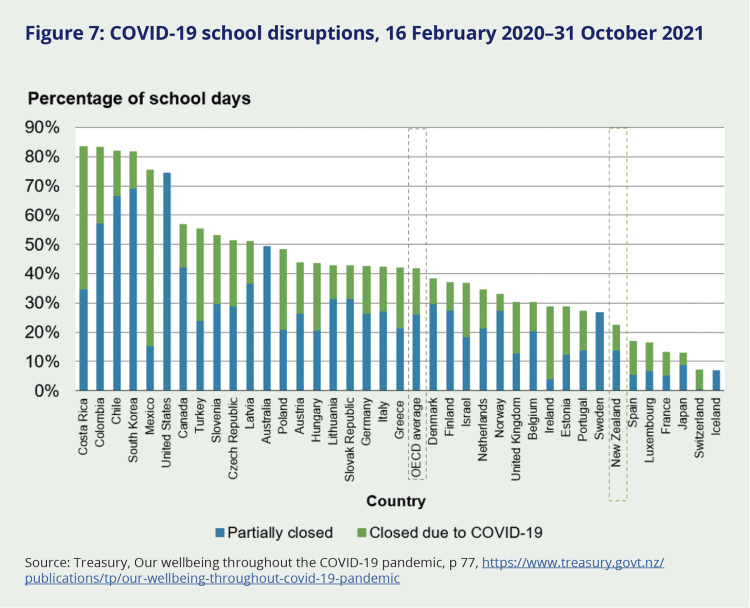
Learners missed fewer days of school in Aotearoa New Zealand than in most comparable countries
When compared internationally, the disruption to education caused by the COVID-19 pandemic in Aotearoa New Zealand was less than that of other OECD countries. Relative to other countries, students here missed fewer days of school instruction, largely due to Aotearoa New Zealand’s shorter time spent in lockdown. In terms of student learning and achievement, Aotearoa New Zealand maintained its relative position compared to other OECD nations.3 This suggests that while students around the world experienced loss of learning from the pandemic, the impact here was no more so than in other comparable countries.iv
Figure 7: COVID-19 school disruptions, 16 February 2020–31 October 2021
Source: Treasury, Our wellbeing throughout the COVID-19 pandemic, p 77, https://www.treasury.govt.nz/publications/tp/our-wellbeing-throughout-covid-19-pandemic
While the pandemic disrupted learning outcomes worldwide, Aotearoa New Zealand learners continued to perform above the OECD average
The impact of school closures on student achievement and academic progress during the pandemic is challenging to assess. However, testing by OECD’s Programme for International Student Assessment (PISA)v in 2022 can be compared with pre-pandemic PISA ratings, especially 2018.
The overall results of the 2022 student testing were mixed.4 They showed that while student learning outcomes declined in some countries during the pandemic years, others remained steady and some actually improved.5 Aotearoa New Zealand’s maths scores were 15 points lower than in 2018 (as was the OECD average), while reading and science scores were largely unchanged.6 In all three areas, New Zealand maintained its relative position compared to other OECD nations, suggesting New Zealand students did experience loss of learning from the pandemic, particularly in maths, but no more so than in other comparable countries.7 Students from low socio-economic backgrounds had a larger drop in maths than more socio-economically advantaged students.8 Considering the overall disruption experienced by learners across the education system during COVID-19, it is positive to see in this data that New Zealand students maintained their relative position and that the country was broadly in line with others in terms of the impact on learning outcomes.
Figure 8: Aotearoa New Zealand’s mean PISA scores compared with other OECD countries (2022)
Aotearoa New Zealand performs relatively well in reading and science, less so in mathematics. Aotearoa New Zealand’s mean PISA score compared to other OECD countries is…
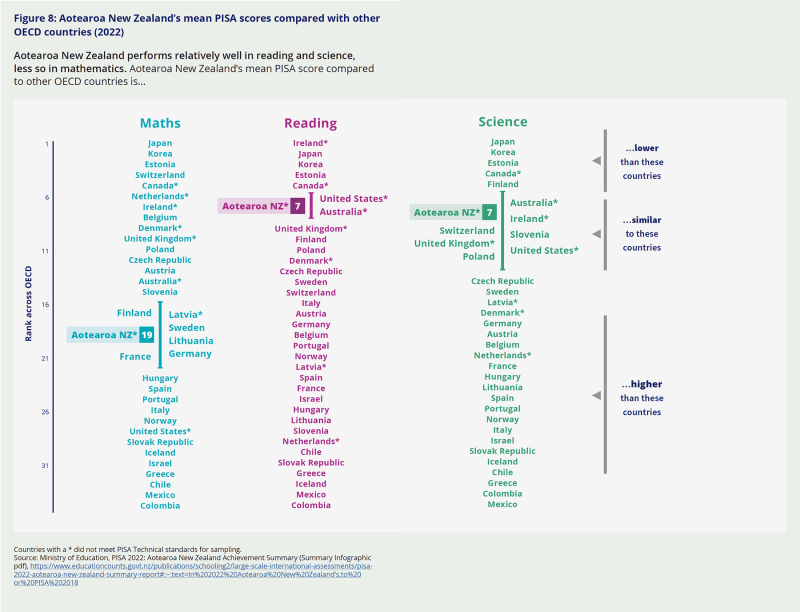
Countries with a * did not meet PISA Technical standards for sampling. Source: Ministry of Education, PISA 2022: Aotearoa New Zealand Achievement Summary (Summary Infographic pdf), https://www.educationcounts.govt.nz/publications/schooling2/large-scale-international-assessments/pisa-2022-aotearoa-new-zealand-summary-report#:~:text=In%202022%20Aotearoa%20New%20Zealand’s,to%20or%20PISA%202018
1.3.3 Conclusion
This brief chapter is not intended to give a comprehensive account of Aotearoa New Zealand’s COVID-19 experience – readers will find a more detailed analysis of the key events and decisions that occurred and the array of health, economic and social outcomes they led to in Chapters 2 to 9.
Instead, it has offered a selective snapshot of how Aotearoa New Zealand fared, compared with other countries, on some key measures. Collectively, the data presented here tells the story of a national response that was effective on many counts.
Aotearoa New Zealand, like countries everywhere, was caught off-guard by COVID-19. We were not prepared for a response that had to be sustained for such a long time, nor for a virus that evolved as it did. And we were affected by other problems that were harder-to-measure – among them societal fragmentation, staff burnout in many sectors and the challenges of balancing collective safety with the rights of individuals. We turn now to examine what this meant for the key elements of New Zealand’s pandemic response, starting with the plans, systems, decision-making structures and strategies adopted across government.
ii Source: Based on data from Our World in Data, 2024, Weekly new hospital admissions for COVID-19 per million, https://ourworldindata.org/grapher/weekly-hospital-admissions-covid-per-million
iii This fact is attributed to the positive impact of lockdowns and other infection control and public health measures on the transmission of other infectious diseases.
iv However, this was not the case for all learners, with negative impacts more pronounced for Māori and Pacific students and those from lower socio-economic backgrounds – this is discussed in more detail in Chapter 3.
v The Programme for International Student Assessment (PISA) is an OECD initiative that compares the standardised reading, maths, and science scores of 15-year-old students selected at random from 81 participating countries, including New Zealand. It is undertaken every two years. There were approximately 250,000 participants in the 2022 study, conducted across 2021-22.

