B.5 Vaccination rates
Home Reports Main Report Appendices B.5 Vaccination rates
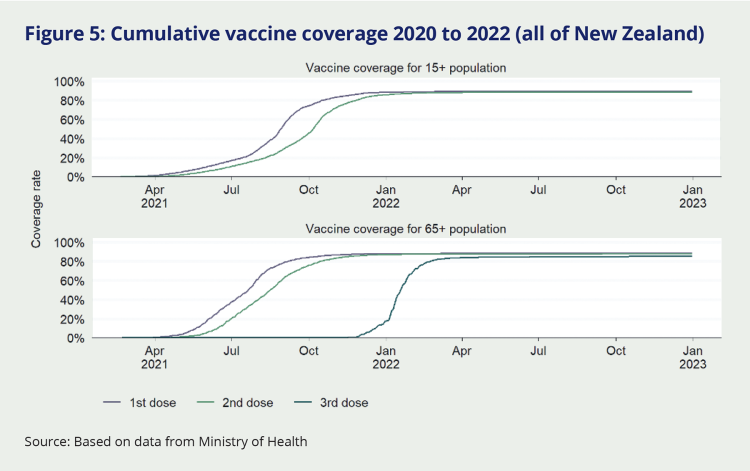
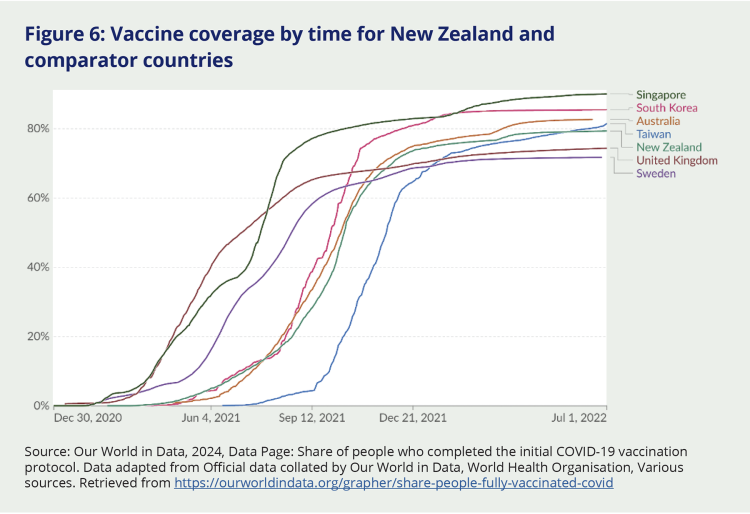
Aotearoa New Zealand’s vaccine coverage for first, second and third doses is shown in Figure 5, and cross-national comparisons of completion of the (usually) two dose primary course is shown in Figure 6. We consider vaccination in depth, from many perspectives, elsewhere in the Report. Suffice to say here:
- New Zealand achieved high vaccination rates, but rollout started a bit later than in many comparator countries.
- Whilst New Zealand’s vaccine levels initially lagged behind some other countries, coverage levels eventually exceeded those of countries such as Sweden and the United Kingdom.
- New Zealand achieved 60 percent coverage of completed vaccination (that is, two doses of Pfizer) on 29 Oct 2021. (The population denominator is all ages, so 60 percent coverage here – for New Zealand – is equivalent to 74 percent coverage among 15+ year olds.) The equivalent coverage was achieved 88 days earlier in Singapore, 76 days earlier in the United Kingdom, 40 days earlier in Sweden, 17 days earlier in South Korea, 4 days earlier in Australia – but 38 days later in Taiwan.
- New Zealand’s rollout of the third dose (first booster) was very rapid, going from 10 percent to 80 percent of 65+ year olds in 64 days, from 20 Dec 2021 to 22 Feb 2022. This rapid rollout was enabled by reducing the time that citizens had to wait after their second dose to receive their third dose, from six to four months, in early 2022 as the Omicron wave was approaching and hitting. This rapid rollout of a third booster dose – boosting people’s immunity to overcome waning after the second dose – undoubtedly saved many lives and reduced the morbidity impact of the Omicron wave.
Figure 5: Cumulative vaccine coverage 2020 to 2022 (all of New Zealand)

Source: Based on data from Ministry of Health
Figure 6: Vaccine coverage by time for New Zealand and comparator countries

Source: Our World in Data, 2024, Data Page: Share of people who completed the initial COVID-19 vaccination protocol. Data adapted from Official data collated by Our World in Data, World Health Organisation, Various sources. Retrieved from https://ourworldindata.org/grapher/share-people-fully-vaccinated-covid

