B.3 Cases, hospitalisations and deaths across 2020 to 2022
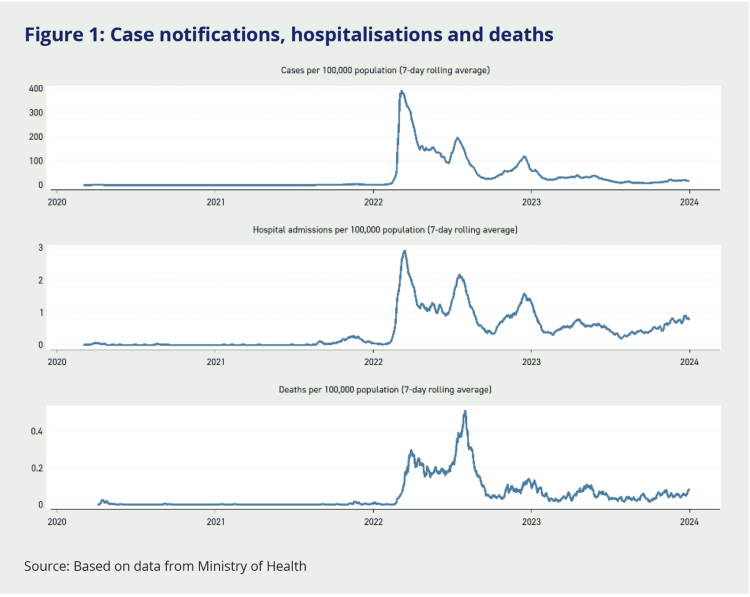
In big-picture terms, Aotearoa New Zealand’s COVID-19 experience was one of very limited viral transmission or disease in 2020 and 2021, followed by significant waves of transmission from the Omicron variant in 2022 (Figure 1). This trajectory reflected the success of the elimination strategy in successfully keeping case rates (and thence hospitalisations and deaths) as low as possible, and often zero, through 2020 and most of 2021. Thus New Zealand did not experience substantial COVID-19 transmission until 2022, by which time the population had very high levels of protection from vaccination coverage.
In 2020 and for much of 2021 we did not know what the circulating pandemic virus variant would be when Aotearoa New Zealand opened up to the rest of the world. One plausible scenario was that the pandemic agent would not mutate much, and that vaccines afforded strong and enduring protection not only against severe illness but also against the chance of getting infected – meaning that we would have experienced much lower case, hospitalisation and death rates than we actually did. Another plausible scenario was similar to what transpired, but that the circulating variant in 2022 was just as infectious as Omicron but with the virulence of Delta or worse, meaning we would have experienced much higher hospitalisation and death rates in 2022 than we actually did – but still, in all likelihood, a considerably lower cumulative morbidity and mortality burden over the whole 2020 to 2022 period compared to a scenario where we had not used an elimination strategy with SARS-CoV-2 freely circulating in New Zealand from 2020. A third plausible scenario – if we were in 2020 and thinking ahead – was that the vaccines would have offered less protection than they did against Omicron, and the morbidity and mortality burden would have been worse.
The scenario we actually experienced, as shown in Figure 1 – whilst not the best scenario we might have hoped for – was a pretty good one. Namely, the elimination strategy worked to keep the virus largely out of Aotearoa New Zealand in 2020 and 2021, and due to widespread vaccination a much lesser cumulative mortality burden than we would have experienced had we allowed the virus in during 2020. (Note, here, we are just considering the health impacts of the pandemic – we consider social and economic impacts in depth elsewhere in the Report.)
Figure 1 shows two major waves in 2022, one peaking in March, the other around July. The second peak features higher hospitalisation and death rates relative to case rates compared to the first wave. This reflects decreasing case ascertainment (as ‘pandemic fatigue’ resulted in fewer people getting tested for COVID-19 and thus lower case reporting) as well as the higher likelihood that people in the second wave would have more severe disease (since the second wave featured higher case rates in older age groups). We now examine outbreaks in 2020 and 2021 in detail.
Cumulatively, Aotearoa New Zealand had 2168, 12,032 and 2,101,473 COVID-19 cases in 2020, 2021 and 2022, respectively. The total number of infections would have been somewhat greater in 2020 and 2021 due to ‘missed’ asymptomatic cases, and considerably greater in 2022 due to ‘pandemic fatigue’ and incomplete reporting of cases (and many more asymptomatic or mild cases that people hardly registered, due to both vaccination and the less virulent nature of Omicron.) No seroprevalence survey was conducted in New Zealand in late 2022 or early 2023, but we know from many such surveys internationally that most of New Zealand’s population would have been would have been infected by late 2022, due to the partial-only and waning protection vaccines offered against infection.
Regarding hospitalisations, Aotearoa New Zealand had 95,851, and 20,920 hospital admissions for COVID-19 in 2020, 2021 and 2022, respectively. And New Zealand had 26, 24 and 2,776 deaths from COVID-19 in 2020, 2021 and 2022, respectively.
Figure 1: Case notifications, hospitalisations and deaths

Source: Based on data from Ministry of Health
The 3,276 COVID-19 deaths in Aotearoa New Zealand from 2020 to 2022 equated to about 3 percent of all deaths in that period – a burden that would have been substantially higher if New Zealand had not followed an elimination strategy. These deaths tended to be among older people. Thus, thinking of these deaths in terms of years of life lost (YLL) is useful, whereby we tally up the expected remaining life expectancy for all people dying. The YLLs due to COVID-19 across 2020 to 2022 were about 1.3 percent of all YLLs from all other deaths in that period.
YLLs only measure the mortality burden of COVID-19. There is also substantial health loss due to morbidity, including symptoms at the time of initial infection, any long COVID, and any sequelae (such as possible increased rates of other diseases after SARS-CoV-2 infection). The morbidity for the acute illness and long COVID components, quantified in years lived with disability (YLDs), might be about 20 percent of the magnitude of the YLL loss.
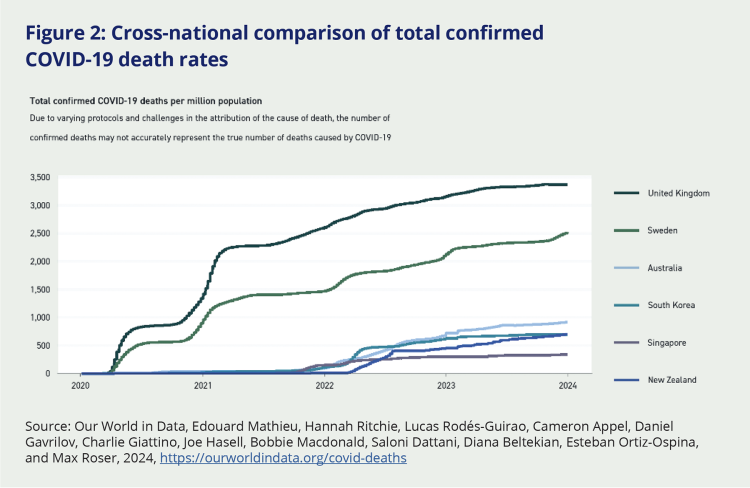
Aotearoa New Zealand compared favourably with other countries on confirmed COVID-19 death rates (Figure 2).
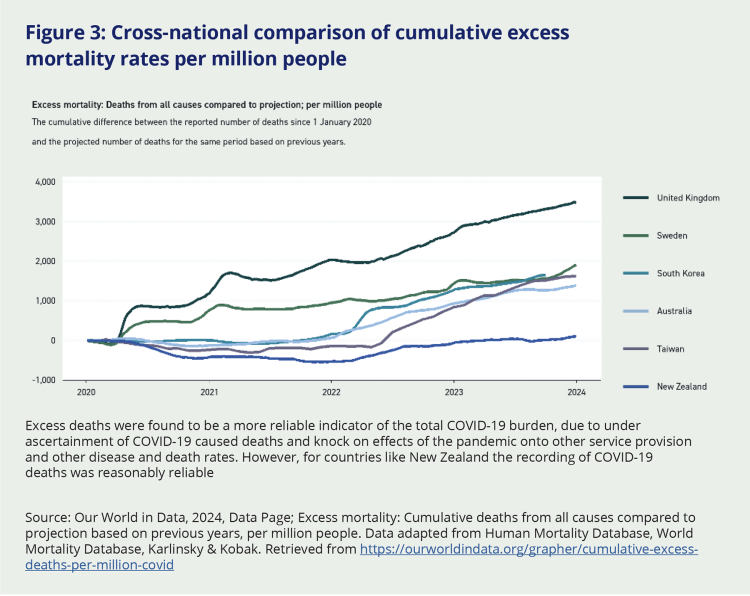
Because public health and social measures are effective in preventing a range of infectious diseases, and death rates from other diseases can also change in a pandemic (e.g. fewer injury-related deaths during lockdowns), another useful way to look at the death burden of the pandemic is excess mortality. Here one uses death rates in the years leading up to the pandemic, and ‘predicts’ what they will be in 2020, 2021 and 2022. These predictions are then compared to the actual total number of deaths occurring. Compared to other countries, Aotearoa New Zealand experienced lower than expected death rates in 2020, and only saw a ‘kick up’ in excess death rates in 2022 (when Omicron washed through), such that by the end of 2022 New Zealand had one of the lowest cumulative excess mortality rates of any country (Figure 3).
Figure 2: Cross-national comparison of total confirmed COVID-19 death rates

Source: Our World in Data, Edouard Mathieu, Hannah Ritchie, Lucas Rodés-Guirao, Cameron Appel, Daniel Gavrilov, Charlie Giattino, Joe Hasell, Bobbie Macdonald, Saloni Dattani, Diana Beltekian, Esteban Ortiz-Ospina, and Max Roser, 2024, https://ourworldindata.org/covid-deaths
Figure 3: Cross-national comparison of cumulative excess mortality rates per million people

Excess deaths were found to be a more reliable indicator of the total COVID-19 burden, due to under ascertainment of COVID-19 caused deaths and knock on effects of the pandemic onto other service provision and other disease and death rates. However, for countries like New Zealand the recording of COVID-19 deaths was reasonably reliable
Source: Our World in Data, 2024, Data Page; Excess mortality: Cumulative deaths from all causes compared to projection based on previous years, per million people. Data adapted from Human Mortality Database, World Mortality Database, Karlinsky & Kobak. Retrieved from https://ourworldindata.org/grapher/cumulative-excess-deaths-per-million-covid

