B.7 Close ups of 2020 and 2021: cases and hospitalisations, alert levels and key policy events
There were three notable outbreaks in New Zealand in 2020 and 2021.
The first of these was in early 2020 (when SARS-CoV-2 first arrived in Aotearoa New Zealand) and involved cases throughout the country (initially, mostly people who had recently travelled overseas). The second occurred in Auckland and was focused on a group of cool store workers; this outbreak was stamped out with the assistance of genomic sequencing supporting contact tracing which helped identify linked cases. The third was the Delta variant outbreak of late 2021, which was mostly confined to the Auckland region (with some reported cases in Northland and the Waikato) and was primarily concentrated among Pacific and Māori communities. The Delta variant is more virulent than the SARS-CoV-2 strains that came before it and the Omicron variants that followed it, which is why the Delta outbreak is more easily visible in the hospital admission and death trends in Figure 1 than the case trends.
B7.1 March to May 2020 outbreak
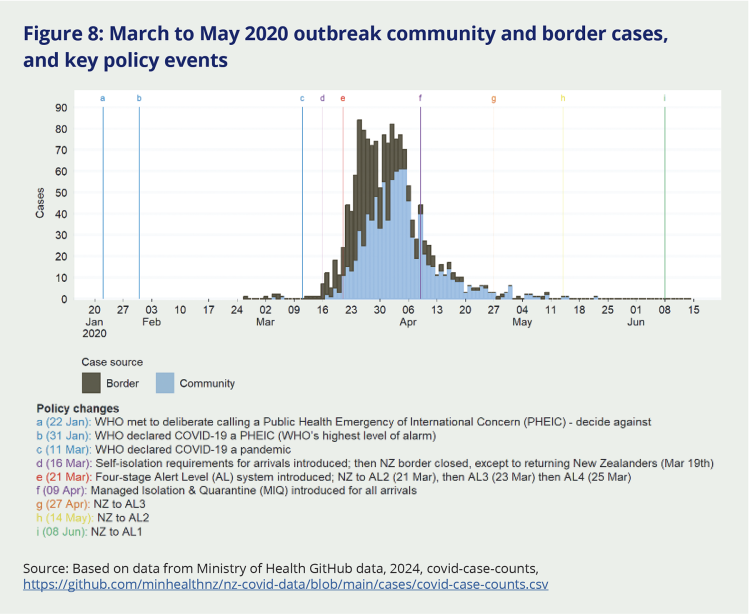
Figure 8 shows the case numbers by day with superimposed policy events (coloured vertical lines; AL = alert level). There was a total of 1,505 cases between February 28 (the first case in Aotearoa New Zealand) and May 22 (the last known community acquired case in the tail of the first outbreak). Of these cases, 38 percent were detected at the border or among recent international arrivals (detected in home isolation that was in place from 16 March to 9 April, and after that detected in MIQ facilities). The border cases were – as expected – dominant at the beginning of the outbreak.
The first reported case on 28 February was a recent arrival from Iran, precipitating an extension of the ban on arrivals from China (instituted on 3 February) to also include arrivals from Iran – although New Zealand citizens could return from either country with self-quarantine. This ban was extended on 2 March to include non-New Zealand citizens having travelled in northern Italy and South Korea.
Aotearoa New Zealand’s second, third and fourth notified cases were reported on 4, 5 and 6 March, respectively.
From 16 March, all international arrivals (except from Pacific Island countries and territories) were required to self-isolate/quarantine for 14 days. Gatherings were limited to a maximum of 500 people, excluding schools and universities. On 19 March, total notified cases were 28, spread across Aotearoa New Zealand. Indoor events were limited to a maximum of 100 people.
On Saturday 21 March, the Alert Level System was introduced, and Aotearoa New Zealand set at Alert Level 2. The alert level was escalated to Alert Level 3 on Monday 23 March, and Alert Level 4 on Wednesday 25 March, putting New Zealand in an unprecedented ‘lockdown’.
Figure 8: March to May 2020 outbreak community and border cases, and key policy events
Source: Based on data from Ministry of Health GitHub data, 2024, covid-case-counts, https://github.com/minhealthnz/nz-covid-data/blob/main/cases/covid-case-counts.csv
Alert levels were unwound to Level 3 on 27 April, Level 2 on 14 May and Level 1 on 8 June. The last case was on 22 May 2020, with a cumulative total of 930 community cases by that date – and nil further community cases for the next 81 days. The successful stamping out of the first outbreak was a joint function of targeted measures like contact tracing, isolation of cases, and quarantine of close contacts, through to the ‘blunt’ population-wide lockdown measures.
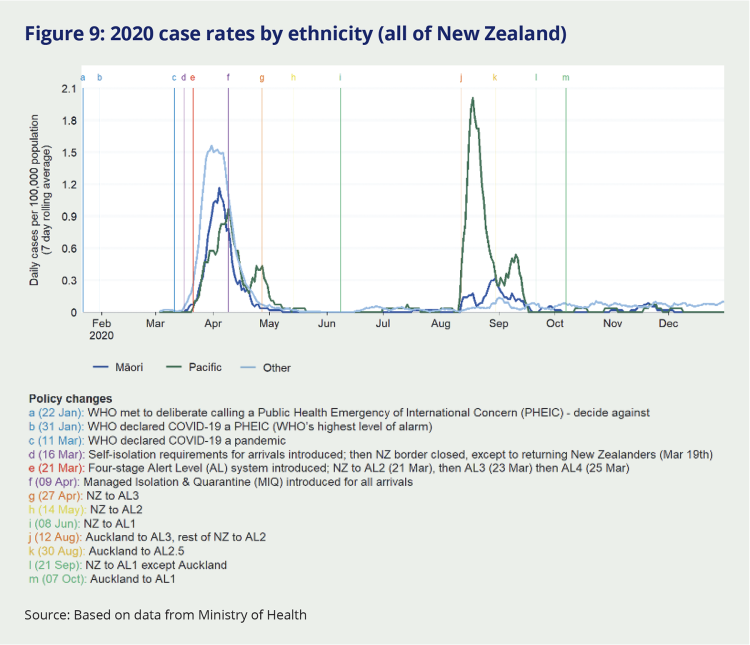
Figure 9 shows the case rates across 2020 by ethnicity. Rates at the outset of the first outbreak were highest among non-Māori and non-Pacific people, a result of most early cases being among recent arrivals to Aotearoa New Zealand and their contacts. Rates by ethnicity in the tail of the first outbreak were roughly equivalent, other than a late small peak among Pacific people.
Figure 9: 2020 case rates by ethnicity (all of New Zealand)
Source: Based on data from Ministry of Health
B7.2 August 2020 South Auckland outbreak
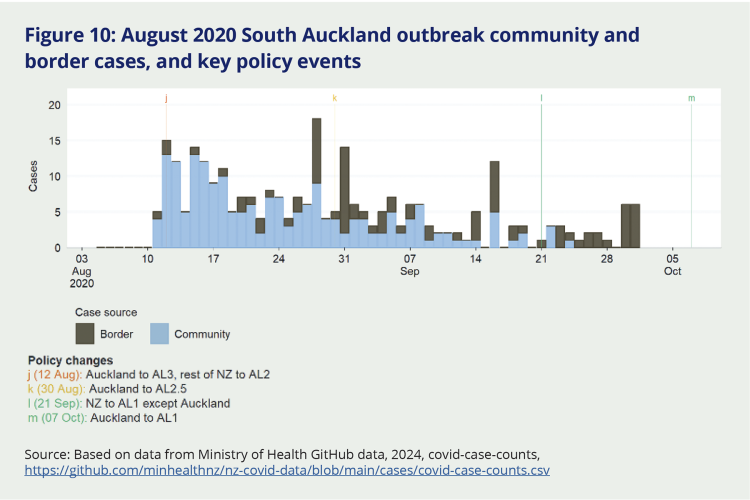
The second outbreak was quite different, with the highest rates among Pacific people (Figure 9), consistent with the origin of this outbreak among workers at a cool store in Mount Wellington, Southeast Auckland. The outbreak comprised 179 known community acquired cases between 11 August and 11 September (Figure 10). Presumably this outbreak was seeded from an international arrival somewhere, but the source was never identified. The outbreak was stamped out with the assistance of genomic sequencing supporting contact tracing and helping identify linked cases.
Figure 10: August 2020 South Auckland outbreak community and border cases, and key policy events
Source: Based on data from Ministry of Health GitHub data, 2024, covid-case-counts, https://github.com/minhealthnz/nz-covid-data/blob/main/cases/covid-case-counts.csv
B7.3 August to December 2021 Delta outbreak
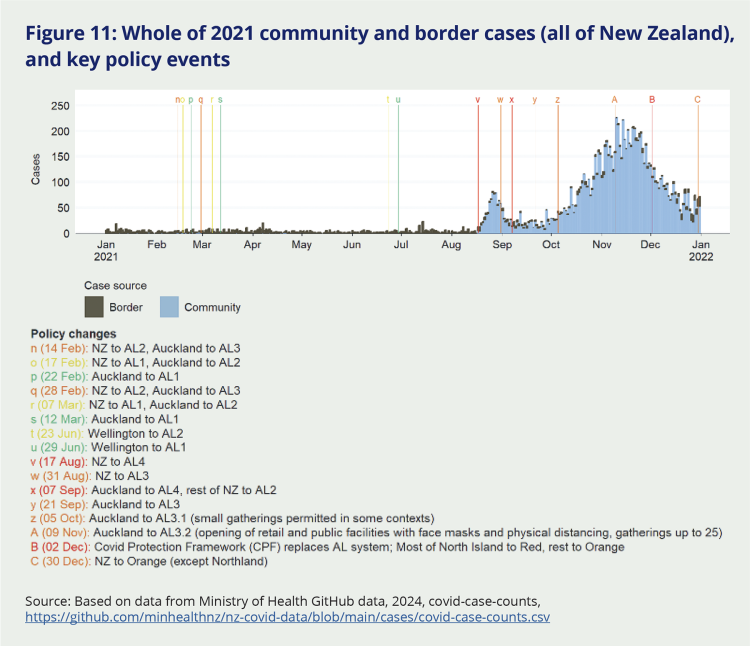
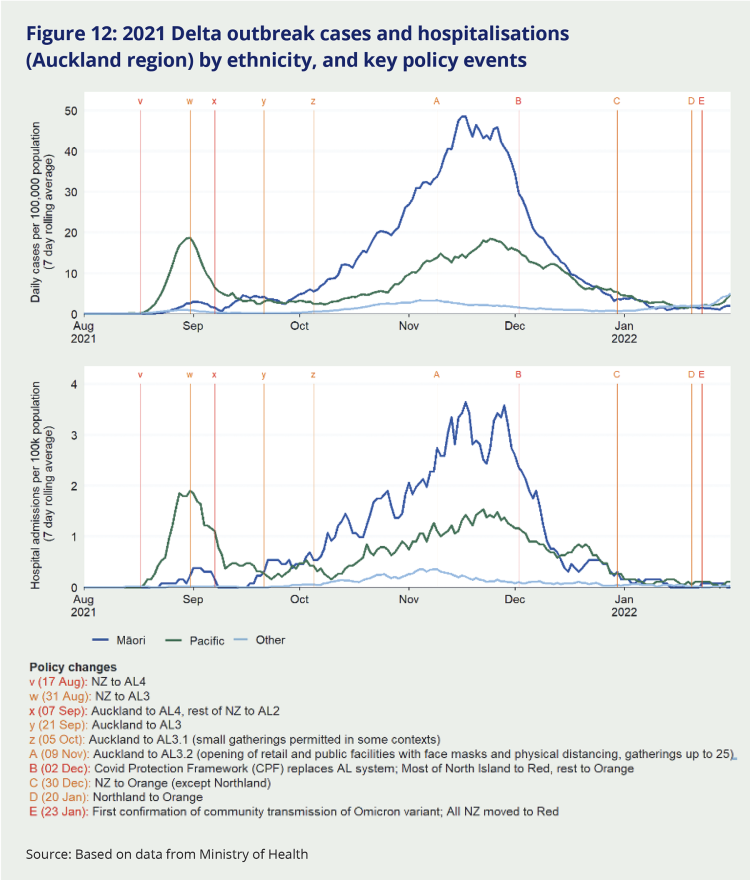
A total of 11,280 Delta cases occurred nationally from August 17 (when the first community cases were detected) to December 31, 2021, of which 84 percent were in Auckland and 44 percent (of the 11,280) were in South Auckland. There were 843 hospitalisations in the same period, and 22 deaths – crudely, a case fatality of 0.2 percent. By ethnicity, the rates were initially highest among Pacific people, then among Māori (Figure 12).
Delta was substantially more infectious than previous variants, making it difficult to stamp out – and indeed it was never fully stamped out before Omicron arrived in 2022. Without the measures in place (Alert Levels 3 and 4; contact tracing, testing and isolation; mask wearing; growing vaccination coverage), Delta would have spread through Aotearoa New Zealand resulting in much greater morbidity and mortality.
Figure 11: Whole of 2021 community and border cases (all of New Zealand), and key policy events
Source: Based on data from Ministry of Health GitHub data, 2024, covid-case-counts, https://github.com/minhealthnz/nz-covid-data/blob/main/cases/covid-case-counts.csv
Figure 12: 2021 Delta outbreak cases and hospitalisations (Auckland region) by ethnicity, and key policy events
Source: Based on data from Ministry of Health
B7.4 Aotearoa New Zealand opens up to Omicron: 2022
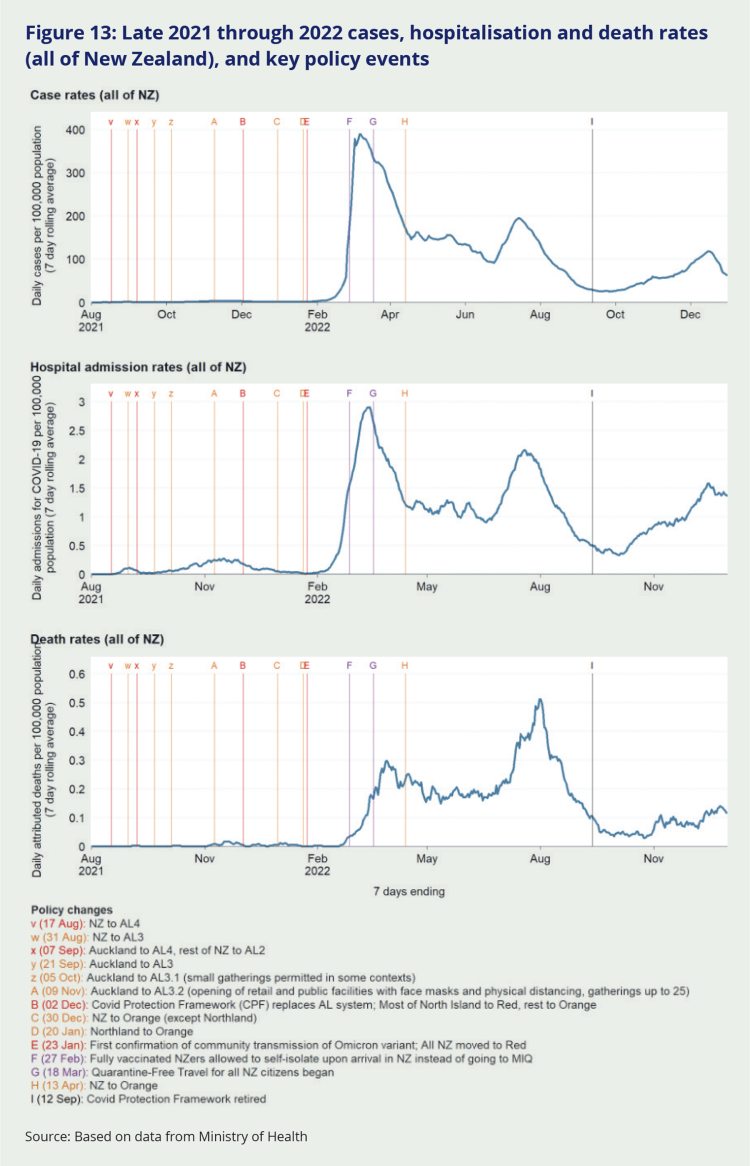
Figure 13 shows the case, hospitalisation and death rates for late 2021 through 2022, and key policy events overlaid. In anticipation of opening (both ending lockdowns and opening international borders), Aotearoa New Zealand moved from the Alert Level System to the COVID-19 Protection Framework (also known as the ‘traffic light’ system) on 3 December 2021. The COVID-19 Protection Framework placed a large emphasis on people having vaccination certificates in order to enter public premises or participate in larger gatherings. It also included some PHSMs such as gathering sizes and physical distancing. The idea of the traffic light system was to provide a framework for containing COVID-19 transmission without having to resort to full lockdowns. The higher settings (orange and red) were to be used initially as a brake on infection rates while the country emerged from the elimination phase and accepted that COVID-19 transmission was now established in the population. These higher settings provided a safeguard against COVID-19 cases growing too rapidly and overwhelming the health system (and society more generally).
Accordingly, all of Aotearoa New Zealand was set to Orange or Red in December 2021. The whole country was at Orange for three days from 20 January 2022 before moving back to Red on 23 January, following the first detected community transmission of Omicron. The country remained at Red through all of February and March 2022. Cases and hospitalisations fell from late March and by April 13 had halved from their peak, precipitating a decision to move down to the Orange traffic light setting. New Zealand remained at Orange through the next 6 months (traversing the second July wave) until the COVID-19 Protection Framework was finally retired on 12 September 2022.
Daily hospitalisation admissions for COVID-19 peaked at nearly 3 per 100,000 (or 150 actual hospitalisations a day) in the first Omicron wave, and at 2 per 100,000 in the second wave. Of note, the mortality rate was higher in the second wave due to older people being more impacted in this wave (see section B8.2).
Figure 13: Late 2021 through 2022 cases, hospitalisation and death rates (all of New Zealand), and key policy events
Source: Based on data from Ministry of Health
