D.3 Data inputs to estimate population immunity
To demonstrate the value of this approach we have prepared an example analysis based on real data from the COVID-19 pandemic, which required the following three data inputs:
- Vaccine coverage by time;
- VE after completing the primary course; and
- How much VE wanes by time after the primary course.
For this appendix, we want to demonstrate how this sort of analysis could be undertaken in a future situation. We have used vaccine coverage data for South Auckland in 2021 provided to our Inquiry by the Ministry of Health and Health New Zealand I Te Whatu Ora. We have also drawn on vaccine effectiveness data after the primary course was taken from analyses of United Kingdom data published in early October 2021. For details on the level and timeline of vaccine-induced protection see Figure 3 in the supplementary material section, which provides further details on the methods for this appendix.
3.1 Modelling example
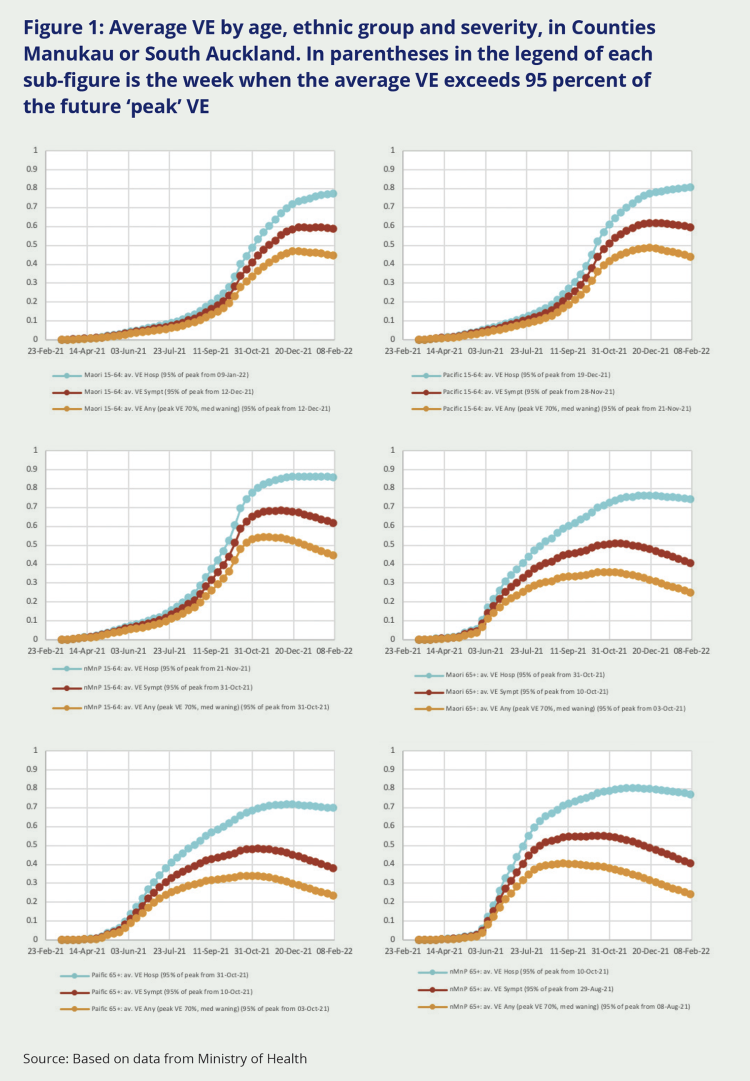
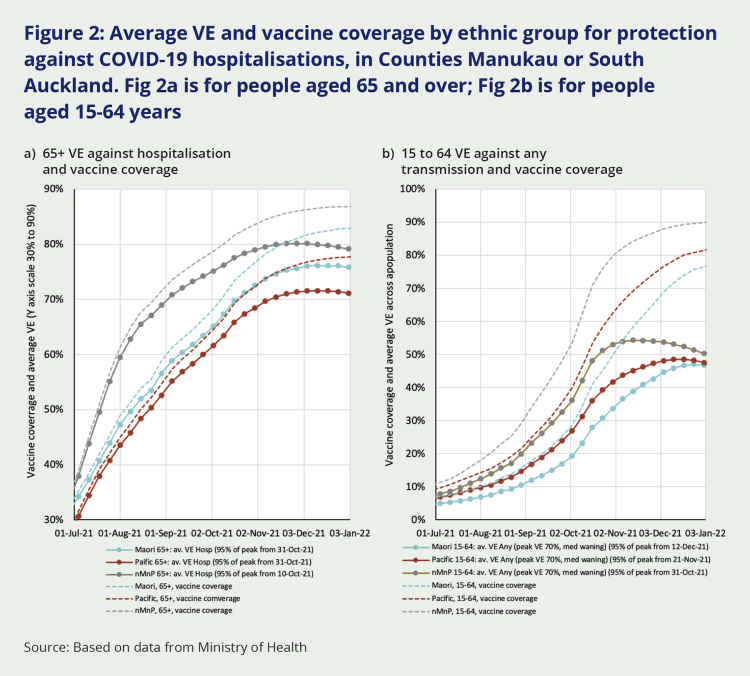
Figure 1 shows the estimated average VE for South Auckland, by ethnic group, age and severity. Figure 2 pulls out findings for what we think are two more important considerations, namely protection against hospitalisation among people aged 65 and over, and protection against any infection among 15- to 64-year-olds (that helps dampen transmission). Vaccine coverage is shown superimposed to help see the difference between coverage and average VE as time progresses.
Key findings from these two figures include:
- Peak VE occurs earliest in non-Māori, non-Pacific people (predominantly European New Zealanders or Pākehā) and latest in Māori – a function of the sequencing of the of vaccine rollout and the different age-distribution of these populations.i
- The average VE peaks first for protection against any infection (because it wanes the fastest, it peaks the earliest), then for protection against symptomatic disease, and finally for protection against hospitalisation.
- Given that the majority of hospitalisations and deaths occur among people aged 65 and over, the average VE against hospitalisation in the 65+ age group is important (see Figure 2a). This analysis suggests that – among those 65 years and older – peak immunityii was reached in the week of:
- 10 October 2021 for non-Māori, non-Pacific people; and
- 31 October 2021 for Māori and Pacific peoples.
- Regarding the ability for the virus to spread in the community, the VE against any infection among 15–64-year-olds is most important (see Figure 2b). This analysis suggests that peak immunity was reached in the week of:
- 31 October for non-Māori, non-Pacific people;
- 21 November for Pacific peoples; and
- 12 December for Māori.
Figure 1: Average VE by age, ethnic group and severity, in Counties Manukau or South Auckland. In parentheses in the legend of each sub-figure is the week when the average VE exceeds 95 percent of the future ‘peak’ VE

Source: Based on data from Ministry of Health
Figure 2: Average VE and vaccine coverage by ethnic group for protection against COVID-19 hospitalisations, in Counties Manukau or South Auckland. Fig 2a is for people aged 65 and over; Fig 2b is for people aged 15-64 years

Source: Based on data from Ministry of Health
By way of a sensitivity analysis, Table 1 shows the week at which each population group would reach 95 percent of peak VE against infection for different levels of VE (at two weeks post vaccination) and different rapidity of waning.iii The date when peak immunity is achieved is not particularly sensitive to these alternative values (as it is more driven by the vaccine rollout itself).
Table 1: Sensitivity analysis about the week that Vaccine Waning against any infection among 15- to 64-year-olds reached 95 percent of its peak, for low, medium and high scenarios of: VE at two weeks post second-dose, and rapidity of waning
| VE at 2 weeks | Waning | Māori 15–64 | Pacific 15–64 | nMnP 15–64 |
|---|---|---|---|---|
| Low VE = 60% | Low waning | 12-Dec-21 | 28-Nov-21 | 31-Oct-21 |
| Med Waning | 05-Dec-21 | 21-Nov-21 | 24-Oct-21 | |
| High waning | 05-Dec-21 | 07-Nov-21 | 24-Oct-21 | |
| Med VE = 70% | Low waning | 19-Dec-21 | 05-Dec-21 | 07-Nov-21 |
| Med Waning | 12-Dec-21 | 21-Nov-21 | 31-Oct-21 | |
| High waning | 05-Dec-21 | 14-Nov-21 | 24-Oct-21 | |
| High VE = 80% | Low waning | 26-Dec-21 | 05-Dec-21 | 07-Nov-21 |
| Med Waning | 12-Dec-21 | 28-Nov-21 | 31-Oct-21 | |
| High waning | 05-Dec-21 | 21-Nov-21 | 31-Oct-21 |
i The vaccine rollout was sequenced by age so that – in the general population – people aged 65 and over became eligible for vaccination before those in younger age groups. Because Māori and Pacific populations have younger age-structure (that is, a greater proportion of their population is in younger age groups), a majority of Māori and Pacific people became eligible for vaccination later than most non-Māori and non-Pacific people.
ii We define ‘peak immunity’ as when the average VE is within 5 percent points of the peak average VE attained.
iii Low and high waning of any infection VE was 50 percent or 150 percent of that derived from Andrews et al (on logit scale).

