B.8 Case, hospitalisation and death rates by socio-demographic groups
B8.1 Summary of health outcomes (2020–2022 inclusive)
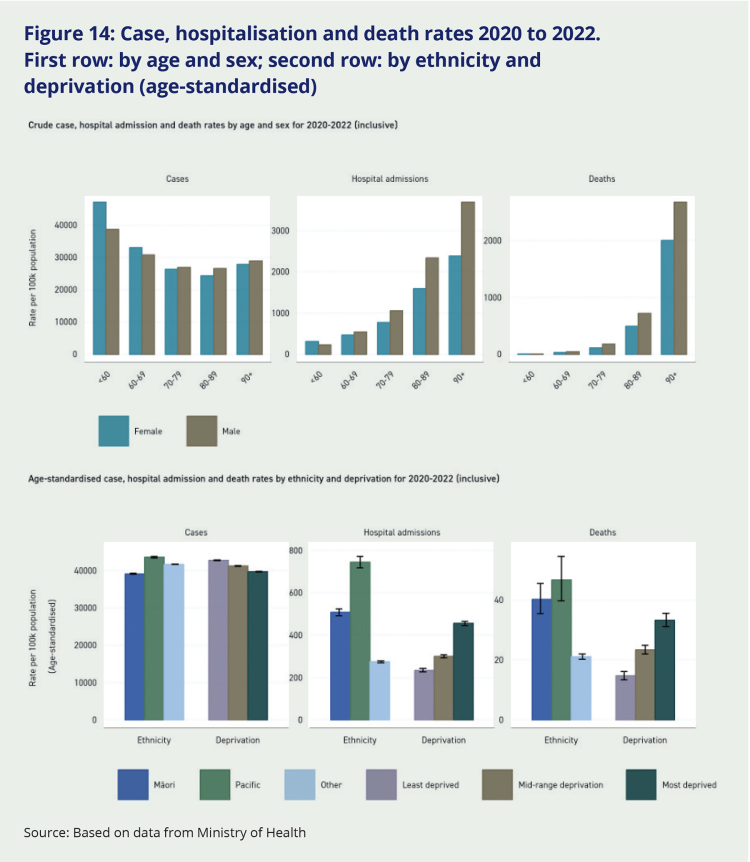
Reported case rates were higher among people less than 60 years old, but hospitalisation rates increased steeply with age above 60 years and death rates even more so (Figure 14). Compared to people aged less than 60, the hospitalisation rates among 60–69, 70–79, 80–89 and 90+ year olds were 1.87, 3.38, 7.13 and 10.6 times greater (respectively), and the death rates were 8.95, 32.5, 135 and 509 times greater (respectively), based on age-standardised rate ratios. Considering absolute numbers, 20 percent of hospitalisations and 66 percent of deaths were among people aged 80 years and over.
Case rates over the full 2020–2022 period did not differ too much by deprivation and ethnicity. (Case rates were much higher among Māori and Pacific populations in the second half of 2020 and 2021, although case numbers were low overall during these periods.) In 2022, case rates were initially higher among Māori, Pasific peoples and people living in more deprived neighbourhoods, although these differences disappeared by the end of 2022 as shown in Figure 15). However, hospitalisation and death rates were considerably higher among Māori and Pacific people over the 2020–2022 period, and among those living in more deprived areas – in part due to their higher rates of infection in 2020 and 2021 (that is, pre-Omicron) with more virulent viruses (such as Delta) and before the protection of vaccinations was available.
Figure 14: Case, hospitalisation and death rates 2020 to 2022. First row: by age and sex; second row: by ethnicity and deprivation (age-standardised)

Source: Based on data from Ministry of Health
B8.2 Trends throughout 2022
Widespread transmission of SARS-CoV-2 in Aotearoa New Zealand occurred in 2022 with the arrival of the Omicron variant. The pandemic spread through different groups with different phasing through 2022:
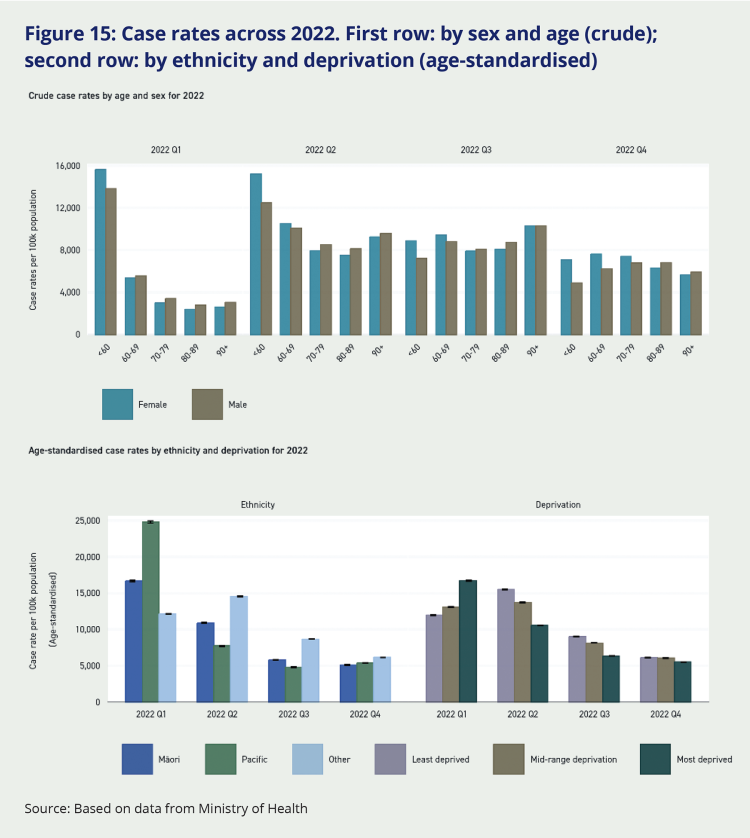
- Case notification rates were initially much higher amongst people less than 60 years of age in the first quarter of 2022, but much the same by age by the fourth quarter (Figure 15). Some of this change might be due to a greater drop-off in testing and self-notification among younger people, as testing shifted from PCR to RAT tests and some people became more ‘relaxed’ about COVID-19 infection.
- Case rates were initially higher among Māori, Pacific peoples and those living in more deprived areas (see Q1). This trend then reversed in quarter 2 (Q2) and quarter 3 (Q3) of 2022; i.e. case rates were higher among non-Māori non-Pacific (Other) ethnic groups and among those living in the least deprived areas. By the end of 2022 (Q4), case rates appeared much the same by ethnicity and area-level deprivation.
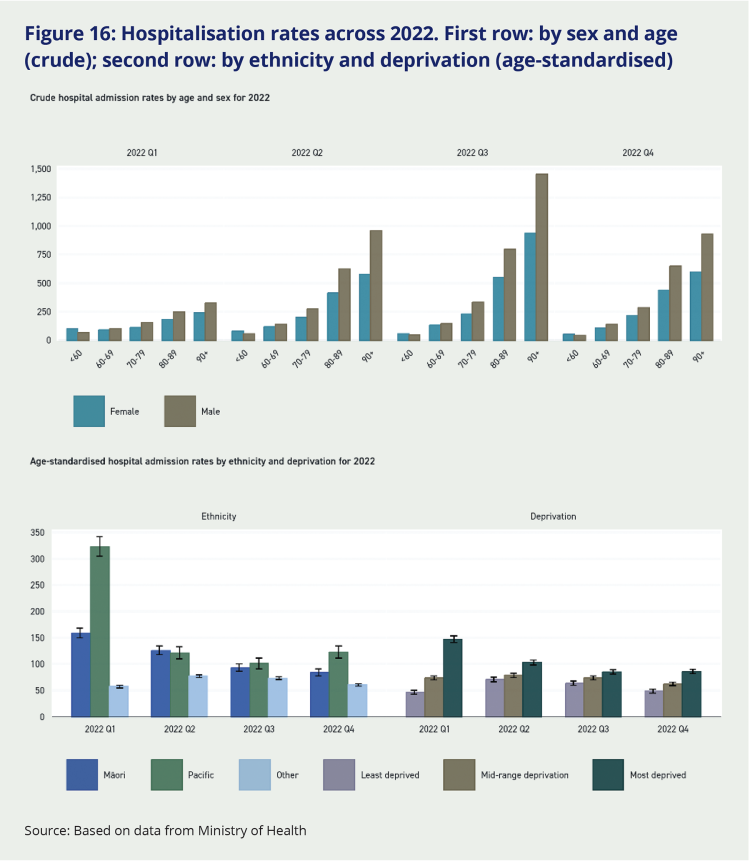
- Hospitalisation rates were consistently higher among older age groups, a trend that became more pronounced from quarter 2 onwards (Figure 16) as older age groups were less protected from infection and started to experience a similar case rate to younger age groups (Figure 15).
- Hospitalisation rates were consistently higher among Māori, Pacific peoples and those living in more deprived areas (Figure 16).
Figure 15: Case rates across 2022. First row: by sex and age (crude); second row: by ethnicity and deprivation (age-standardised)

Source: Based on data from Ministry of Health
Figure 16: Hospitalisation rates across 2022. First row: by sex and age (crude); second row: by ethnicity and deprivation (age-standardised)

Source: Based on data from Ministry of Health
Hospitalisation trends approximately follow the shape of case trends, but the inequities between groups are more pronounced. Māori and Pacific people have substantially elevated relative hospitalisation rates despite their younger population structure, and this becomes more pronounced once age is adjusted for.
There is also a clear and consistent pattern of higher hospitalisation rates for people living in higher deprivation areas.
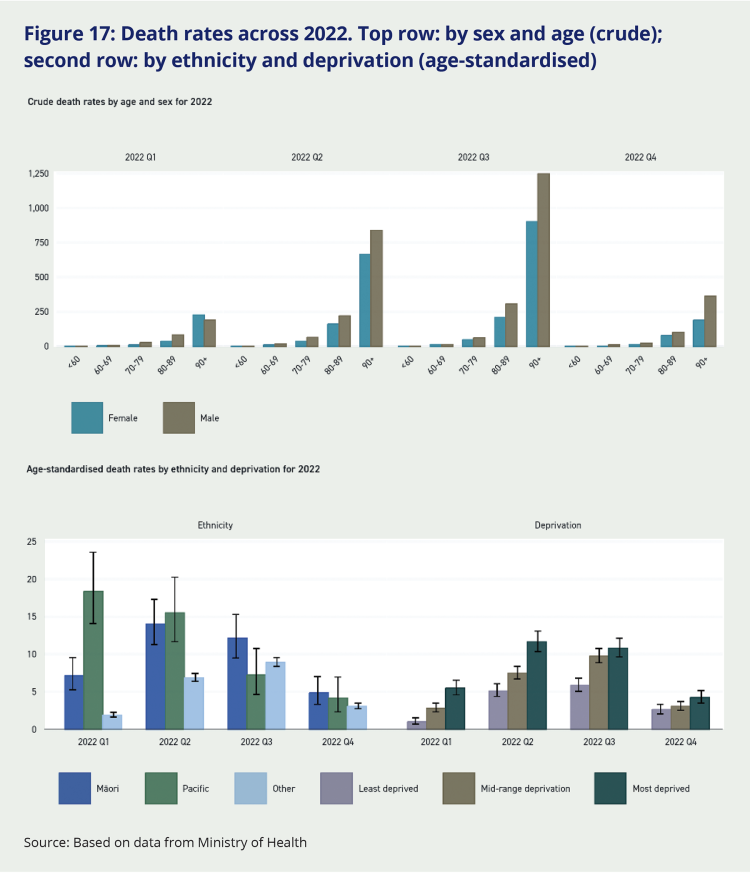
Figure 17: Death rates across 2022. Top row: by sex and age (crude); second row: by ethnicity and deprivation (age-standardised)

Source: Based on data from Ministry of Health
Figure 17 shows both crude and age-adjusted death rates from COVID-19 as they changed across the four quarters of 2022. At all time-points the risk of dying from COVID-19 was strongly patterned by age, with people in older age groups (80-89 years and 90 years and over) much more likely to die from COVID-19.
The risk of dying from COVID-19 was also consistently higher for Māori and Pacific peoples. Higher death rates for Māori and Pacific in quarter 1 of 2022 are partly a reflection of their higher case rates at that time. As the year progressed, the pandemic spread more to the rest of the population (non-Māori non-Pacific or ‘Other’), which is older on average than Māori and Pacific populations. In the latter part of 2022, a majority of COVID-19 deaths were occurring in non-Māori non-Pacific (‘Other’) ethnic groups, predominantly New Zealand European or Pākehā.
The age-standardised death rates can be understood as showing how the risk of dying from COVID-19 compared for people of the same age who belonged to different ethnic groups or who lived in areas of greater or lesser deprivation. The younger age structure of Aotearoa New Zealand’s Māori and Pacific populations means their crude death rates from COVID-19 are lower than that of non-Māori non-Pacific (or ‘Other’) ethnic groups, but their age-standardised death rates are much higher. People living in areas of higher socio-economic deprivation had higher death rates than less deprived people throughout the course of the pandemic. This trend is particularly clear and consistent in the age-adjusted rates.
8.3 Multivariable regression analyses for 2022 to determine total and mediated effect for ethnicity, deprivation and co-morbidity
For 2022 there were sufficient numbers of hospitalisations and deaths to undertake multivariable regression modelling. The purpose of these analyses was to determine:
- The ethnicity rate ratio (RR) differences, adjusted for sex and age (which should align closely with the above age-standardised analyses)
- How much of this ethnic difference was due to mediation by deprivation, and by deprivation and co-morbidity
- The deprivation RR differences, adjusted for sex and age, and adjusted for ethnicity (which is a prior determinant of deprivation)
- How much of the deprivation difference was due to mediation by co-morbidity
- The co-morbidity RR difference, adjusted for sex, age, ethnicity and deprivation.
8.3.1 Hospitalisations
Rate ratios from the Poisson regression for hospitalisations are shown in Table 2.
Māori and Pacific people had a 74 percent and 140 percent increased rate of hospitalisation respectively compared to non-Māori non-Pacific and non-Asian people respectively, adjusted for sex and age. About a third of these elevated risks for Māori and Pacific people were attributable to differing levels of deprivation (excess risks reducing from 70 percent to 45 percent for Māori, and from 140 percent to 100 percent for Pacific people). Another third (Māori) and 16 percent (Pacific) was due to differences by ethnicity in co-morbidities. Thus, the ethnic differences adjusted for both deprivation and co-morbidity reduced to RRs of 1.31 and 1.84 for Māori and Pacific people, respectively.
There was a deprivation gradient in hospitalisations (adjusting for sex, age and ethnicity), that monotonically increased from 16 percent to 31 percent to 51 percent to 79 percent higher hospitalisation rates for quintiles 2, 3, 4 and 5 (the most deprived) each compared to the least deprived. These deprivation differences reduced by about a third when adjusting for co-morbidity.
Having any co-morbid conditions, compared to nil, adjusted for sex, age, ethnicity and deprivation, was associated with a 4.58-fold increased rate of hospitalisation.
Table 2: Multivariable regression results for hospitalisations in New Zealand in 2022
| Sex+Age+Ethnicity | Sex+Age+Ethnicity+Deprivation | Sex+Age+Ethnicity+Deprivation+Co-morb | ||||||||
|---|---|---|---|---|---|---|---|---|---|---|
|
Hospitalisations |
Popn |
Incidence (per 10K) | Rate Ratio | 95% CI | Rate Ratio | 95% CI | Rate Ratio | 95% CI | ||
| Total | 2,883 | 5,279,183 | (37.4) | |||||||
| Sex | Male | 9,488 | 2,611,562 | (36.3) | 0.99 | (0.96-1.02) | 0.99 | (0.96-1.02) | 1.00 | (0.98-1.03) |
| Female | 10,207 | 2,660,073 | (38.4) | Baseline | Baseline | Baseline | ||||
| Age group (years) | <20 | 3,222 | 1,339,719 | (24.0) | 1.17 | (1.11–1.23) | 1.20 | (1.14-1.26) | 1.37 | (1.30-1.44) |
| 20-39 | 2,815 | 1,459,251 | (19.3) | Baseline | ||||||
| 40-59 | 3,624 | 1,309,742 | (27.7) | 1.49 | (1.42–1.57) | 1.52 | (1.44–1.60) | 1.28 | (1.22–1.35) | |
| 60-79 | 5,894 | 960,504 | (61.4) | 3.47 | (3.31–3.63) | 3.28 | (3.32–3.65) | 2.14 | (2.04–2.25) | |
| 80+ | 4,169 | 209,967 | (198.6) | 11.85 | (11.27–12.46) | 11.66 | (11.08–12.28) | 5.00 | (4.73–5.29) | |
| Prioritised ethnicity | Māori | 3,411 | 823,353 | (41.4) | 1.70 | (1.63–1.77) | 1.45 | (1.39-1.52) | 1.31 | (1.26-1.37) |
| Pacific | 2,351 | 398,516 | (59.0) | 2.40 | (2.29–2.51) | 2.00 | (1.91–2.11) | 1.84 | (1.75–1.93) | |
| Asian | 1,981 | 844,255 | (23.5) | 0.94 | (0.89–0.98) | 0.93 | (0.88–0.98) | 1.01 | (0.96–1.06) | |
| Other | 11,938 | 3,177,450 | (37.6) | Baseline | Baseline | Baseline | ||||
| Deprivation (quintiles) | least | 2,580 | 1,032,923 | (25.0) | Baseline | Baseline | ||||
| Quintile 2 | 3,531 | 1,008,474 | (30.5) | 1.16 | (1.10–1.22) | 1.11 | (1.16–1.17) | |||
| Quintile 3 | 3,531 | 1,011,426 | (34.9) | 1.31 | (1.24–1.38) | 1.22 | (1.16–1.62) | |||
| Quentile 4 | 4,231 | 1,023,503 | (41.3) | 1.51 | (1.44–1.59) | 1.35 | (2.04–2.25) | |||
| most | 5,349 | 1,053,471 | (50.8) | 1.79 | (1.70–1.88) | 1.54 | (1.47–1.62) | |||
| Co-morbidity | No | 9,488 | 2,611,562 | (36.3) | Baseline | |||||
| Yes | 10,207 | 2,660,073 | (38.4) | 4.58 | (4.43–4.73) | |||||
Source: Based on data from Ministry of Health
8.3.2 Deaths
Rate ratios from the Poisson regression for hospitalisations are shown in Table 2.
Māori and Pacific peoples had a 74 percent and 100 percent increased rate of death from COVID-19 compared to people in non-Māori, non-Pacific ethnic groups. (People of Asian ethnicity had a 40 percent lower death rate.) About a third of the elevated mortality risk for Māori and Pacific peoples was linked with their greater likelihood of living in a socio-economically deprived area. And roughly a further quarter of their increased risk could be linked with their higher level of co-morbidity. After adjustment for deprivation and co-morbidity (in addition to age and sex), the risk of COVID-19 mortality remained 38 percent higher in Māori and 55 percent higher in Pacific peoples, respectively.
There was a strong deprivation gradient in COVID-19 mortality (adjusting for sex, age and ethnicity) whereby the death rate from COVID-19 increased monotonically by quintiles of area-level deprivation. Compared with people living in the least deprived quintile (quintile 1), the COVID-19 death rate increased by 47 percent to 83 percent to 111 percent to 125 percent for people living in quintiles 2, 3, 4 and 5 (the most deprived) respectively. These differences by deprivation reduced by about 20 percent following adjustment for co-morbidity.
Having any co-morbid conditions (compared with none) was associated with a 4.25-fold increased risk of COVID-19 death independent of any effect from age, sex, ethnicity or deprivation.
Table 3: Multivariable regression results for COVID-19 deaths in New Zealand in 2022
| Sex+Age+Ethnicity | Sex+Age+Ethnicity+Deprivation | Sex+Age+Ethnicity+Deprivation+Co-morb | ||||||||
|---|---|---|---|---|---|---|---|---|---|---|
|
Hospitalisations |
Popn |
Incidence (per 10K) | Rate Ratio | 95% CI | Rate Ratio | 95% CI | Rate Ratio | 95% CI | ||
| Total | 2,883 | 5,279,183 | (54.6) | |||||||
| Sex | Male | 1,506 | 2,611,562 | (57.7) | Baseline | Baseline | Baseline | |||
| Female | 1,365 | 2,660,073 | (51.3) | 0.68 | (0.63–0.73) | 0.65 | (0.60–0.70) | 0.68 | (0.63–0.73) | |
| Age group (years) | <20 | 174 | 4,108,712 | (4.2) | 0.10 | (1.11–1.23) | 1.10 | (0.08–0.13) | 0.15 | (0.12-0.18) |
| 20-39 | 225 | 573,326 | (39.2) | Baseline | Baseline | Baseline | ||||
| 40-59 | 564 | 387,178 | (145.7) | 3.87 | (3.31–4.52) | 3.79 | (3.23–4.45) | 3.10 | (2.64–3.64) | |
| 60-79 | 1,062 | 172,444 | (615.9) | 17.03 | (14.73–19.69) | 16.49 | (14.21–19.14) | 11.04 | (9.46–12.87) | |
| 80+ | 858 | 37,523 | (2286.6) | 66.78 | (57.58–77.45) | 64.07 | (55.00–74.64) | 37.31 | (31.77–43.81) | |
| Prioritised ethnicity | Māori | 256 | 823,353 | (31.1) | 1.74 | (1.53–1.98) | 1.51 | (1.32–1.73) | 1.38 | (1.20–1.59) |
| Pacific | 156 | 398,516 | (39.1) | 2.00 | (1.70–2.35) | 1.71 | (1.44–2.02) | 1.55 | (1.31–1.84) | |
| Asian | 112 | 844,255 | (13.3) | 0.60 | (0.49–0.72) | 0.60 | (0.50–0.73) | 0.66 | (0.54–0.80) | |
| Other | 2,343 | 3,177,450 | (73.7) | Baseline | Baseline | Baseline | ||||
| Deprivation (quintiles) | least | 267 | 1,032,923 | (25.8) | Baseline | Baseline | ||||
| Quintile 2 | 472 | 1,008,474 | (46.8) | 1.47 | (1.27–1.71) | 1.40 | (1.20–1.63) | |||
| Quintile 3 | 1,011,426 | (60.8) | 1.83 | (1.58–2.11) | 1.70 | (1.47–1.96) | ||||
| Quentile 4 | 730 | 1,023,503 | (71.3) | 2.11 | (1.83–2.43) | 1.90 | (1.65–2.19) | |||
| most | 638 | 1,053,471 | (60.6) | 2.25 | (1.95–2.61) | 1.99 | (1.72–2.30) | |||
| Co-morbidity | No | 632 | 4,527,583 | (14.0) | Baseline | |||||
| Yes | 2,251 | 751,600 | (299.5) | 4.25 | (3.81–4.74) | |||||
Source: Based on data from Ministry of Health

