5 - A snapshot of Aotearoa New Zealand's pandemic experience He tirohanga ki ngā wheako o Aotearoa mō te mate urutā
Home Reports Summary Report Part Two: Lessons learned from Looking Back 5 - A snapshot of Aotearoa New Zealand's pandemic experience
Introduction | Kupu whakataki
This chapter provides a series of facts, figures and graphics to remind or introduce readers to some of the key aspects of the COVID-19 pandemic in Aotearoa New Zealand, along with international comparisons.
Compared to other countries, Aotearoa New Zealand’s COVID-19 response was effective at both protecting people from the health effects of the virus, and minimising the potential economic, social and wellbeing impacts of the pandemic. That is not to say the response was perfect; it wasn’t, and challenges emerged as the response wore on. We look at these challenges, and other areas where lessons can be learned, in the following chapters.
Note: This chapter is not intended to give a comprehensive account of Aotearoa New Zealand’s COVID-19 experience. Instead, it offers a selective snapshot of how Aotearoa fared, compared with other countries, on some key measures. For more detail, please refer to Chapter 1 in Part Two of our main report, and the other chapters in this ’Lessons learned from looking back’ section.
For more on lockdowns, see Chapter 7 of this report.
Lockdowns were a key measure used throughout the Government’s response to the COVID-19 pandemic. Under Alert Level 4 (full or ’hard’ lockdown), Aotearoa New Zealand’s control measures were stricter than many other countries. But New Zealanders spent comparatively little time under these conditions. After the initial lockdown in March 2020, Aotearoa New Zealand spent much of 2020 and the first half of 2021 at Alert Level 1. During these periods, people faced far fewer domestic restrictions and New Zealanders were able to enjoy relatively normal lives for long periods of time. People could gather in large numbers again, and travel domestically to visit family and friends.
Aotearoa New Zealand’s early use of lockdowns and other restrictions helped prevent widespread COVID-19 infection until most of the population was vaccinated and the virus had become less deadly.
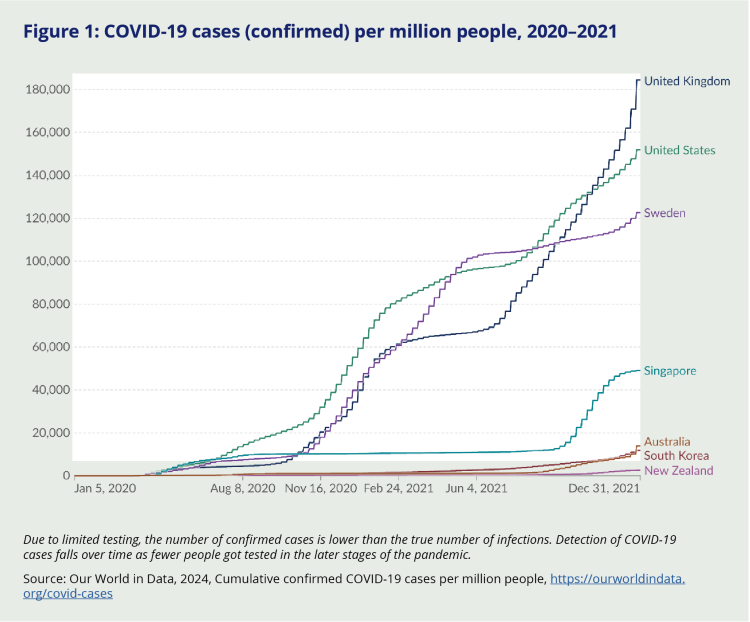
In the first two years of the pandemic, Aotearoa New Zealand had far fewer COVID-19 cases than most other countries and protected many vulnerable communities (including older people, disabled people, immunocompromised people).
Figure 1: COVID-19 cases (confirmed) per million people, 2020–2021

Due to limited testing, the number of confirmed cases is lower than the true number of infections. Detection of COVID-19 cases falls over time as fewer people got tested in the later stages of the pandemic.
Source: Our World in Data, 2024, Cumulative confirmed COVID-19 cases per million people, https://ourworldindata.org/covid-cases.
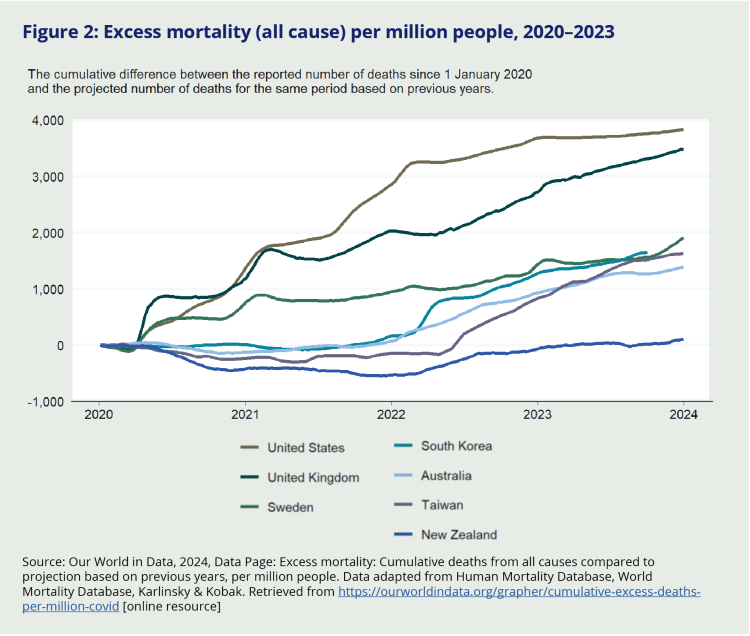
Aotearoa New Zealand also had one of the lowest rates of COVID-19 deaths per head of the population when compared to other OECD countries.
From early 2020 to early 2023, the country actually experienced ’negative’ excess mortality, meaning there were fewer deaths in that time period than what would have been expected during a ’normal’ year.
Figure 2: Excess mortality (all cause) per million people, 2020–2023

Source: Our World in Data, 2024, Data Page: Excess mortality: Cumulative deaths from all causes compared to projection based on previous years, per million people. Data adapted from Human Mortality Database, World Mortality Database, Karlinsky & Kobak. Retrieved from https://ourworldindata.org/grapher/cumulative-excess-deaths-per-million-covid [online resource]
For more on the health system response, see Chapter 9 of this report.
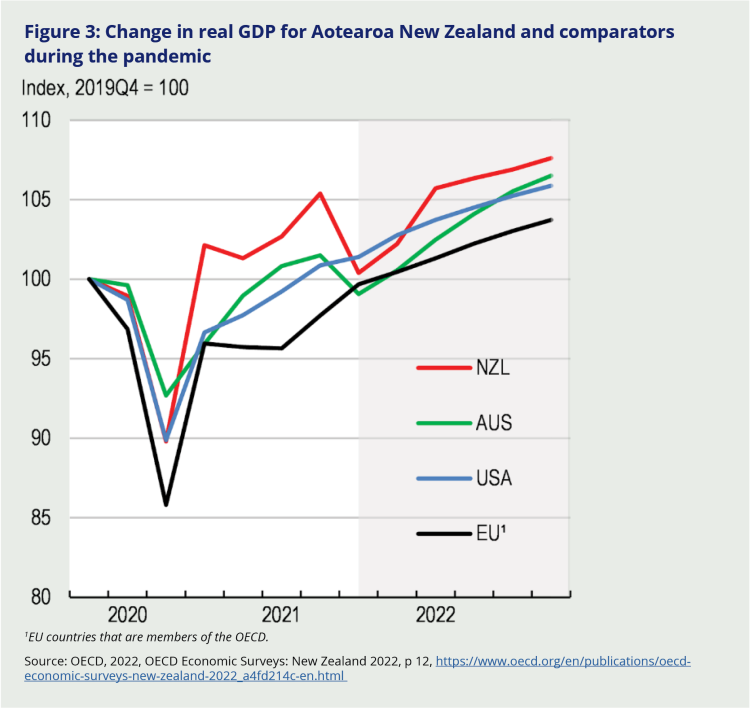
Like most places in the world, the arrival of the pandemic was accompanied by an immediate dip in GDP, reflecting the global impact that lockdowns had on employment and economic activity. While Aotearoa New Zealand’s initial GDP fall was similar to other OECD countries, the economy recovered here more quickly and strongly than others. By the third quarter of 2020, the economy regained its pre-pandemic levels and remained above this level through to the end of 2022.
Figure 3: Change in real GDP for Aotearoa New Zealand and comparators during the pandemic

1EU countries that are members of the OECD.
Source: OECD, 2022, OECD Economic Surveys: New Zealand 2022, p 12, https://www.oecd.org/en/publications/oecd-economic-surveys-new-zealand-2022_a4fd214c-en.html
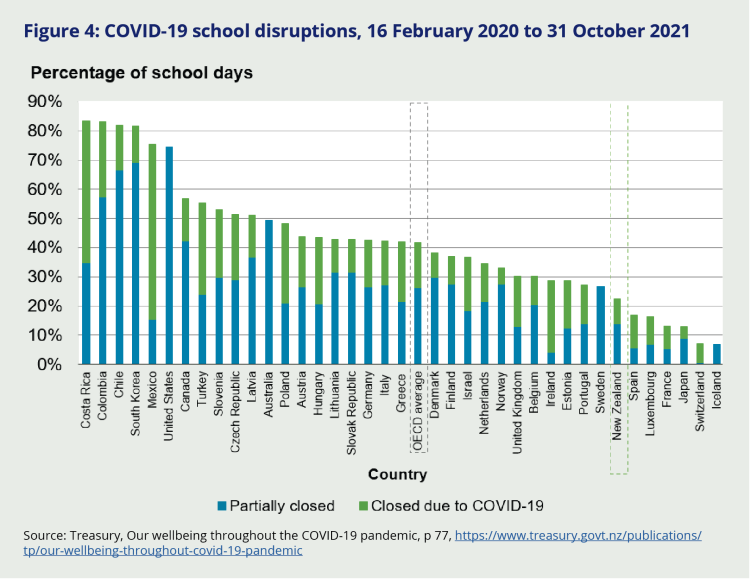
Aotearoa New Zealand’s education sector was heavily impacted by the pandemic and the Government’s response measures. However, when compared internationally, students here missed fewer days of school instruction and experienced less disruption than other OECD countries.
Student achievement and academic progress was challenging to assess during the pandemic. However, when compared to other OECD countries using Programme for International Student Assessment (PISA) data, New Zealand students maintained their relative position amongst comparative countries.
Figure 4: COVID-19 school disruptions, 16 February 2020 to 31 October 2021

Source: Treasury, Our wellbeing throughout the COVID-19 pandemic, p 77, https://www.treasury.govt.nz/publications/tp/our-wellbeing-throughout-covid-19-pandemic.
For more on the economic and social impacts and responses, see Chapter 10 of this report.
This brief snapshot is not intended to give a comprehensive account of Aotearoa New Zealand’s COVID-19 experience – readers will find more detail and analysis of the key events and decisions that occurred, and the array of health, economic and social outcomes they led to, in the following chapters.
Aotearoa New Zealand, like countries everywhere, was caught off-guard by COVID-19. We were not prepared for a response that had to be sustained for such a long time.
Instead, we offer a brief overview of how Aotearoa New Zealand fared, compared with other countries, on some key measures. Collectively, the data tells the story of a national response that was effective on many counts.
Aotearoa New Zealand, like countries everywhere, was caught off-guard by COVID-19. We were not prepared for a response that had to be sustained for a such a long time, nor for a virus that evolved as it did. While Aotearoa New Zealand’s response to the pandemic overall received much international praise, it is important to take stock of what went well and what could be improved. As a lessons-focused Inquiry, we do precisely that in the following chapters.

